



ABSTRACT:
OBJECTIVE: This study examined the effects of socioeconomic status as a possible moderator of
the effects of family conflict on externalizing/internalizing behavior and hippocampal
and amygdala volume.
METHODS: A longitudinal complete-case analysis of 714 children and adolescents (mean age: 11.2
years; 46.2% female) was conducted using data from the Brazilian High-Risk Cohort
Study for Psychiatric Disorders in Childhood. At baseline, parents/guardians completed
the Family Environment Scale and a socioeconomic status scale. Three years after baseline
assessment, the same participants underwent brain magnetic resonance imaging, and
the Child Behavior Checklist was administered. Automated segmentation of the amygdala
and hippocampus was performed in FreeSurfer 5.1.
RESULTS: Although family conflict at baseline predicted externalizing/internalizing behavior
at follow-up, we found no evidence that family conflict and socioeconomic status affected
brain structure or that family conflict had a moderating effect on psychopathology
and brain outcomes conditioned on socioeconomic status.
CONCLUSION: These results are consistent with emerging evidence that family conflict is a risk
factor for externalizing/internalizing behavior in youth. These findings warrant further
attention, focusing on prevention and intervention efforts and social policy development.
Keywords: Child behavior; socioeconomic status; family conflict; brain structure.
| Note: How to cite this article: Trejos-Castillo E, Mastergeorge A, Cogo-Moreira H, Santana VO, Zugman A, de Araújo CM, et al. Can socioeconomic status moderate the effect of a conflictive family environment on brain structure and externalizing/internalizing behavior in children and adolescents? Braz J Psychiatry. 2025;47:e20254195. http://doi.org/10.47626/1516-4446-2025-4195 |
| Received: February 24 2025; Accepted: May 07 2025 |
INTRODUCTION
The family environment significantly influences child behavioral and neurodevelopmental outcomes, encompassing various factors, such as family composition, home environment, parenting behaviors, interaction styles, and parental mental health and functioning. For instance, positive parenting practices - such as warmth, support, and effective communication - foster resilience and healthy emotional development in children.1 Conversely, a dysfunctional family environment marked by low parental acceptance and family conflict is associated with an increased risk of psychopathology in children. Specifically, higher levels of family conflict can lead to both internalizing behaviors, such as anxiety and depression, and externalizing behaviors, such as aggression and defiance.2 Moreover, parental mental health issues, including depression and anxiety, can negatively affect parenting quality, further exacerbating behavioral challenges in children.3
During brain development, windows of vulnerability from the fetal period to adolescence render the brain particularly sensitive to environmental influences. Key factors include family dynamics, parental attitudes, maternal depression, social deprivation, and low socioeconomic status (SES).4 Early childhood5 and puberty6,7 are especially critical periods, characterized by rapid neurobiological and hormonal changes that can profoundly impact neurodevelopmental outcomes. The interplay of these environmental factors can adversely affect cognitive and emotional development, underscoring the detrimental impact of a negative or unresponsive environment during these formative years.
In developmental psychopathology, the relationship between brain structure and behavior is complex, particularly concerning whether reductions in cerebral grey matter volume are more closely associated with comorbid dimensions like internalizing or externalizing factors than specific neurodevelopmental disorders.8 In a large community sample of children (n=254), it was found that grey matter volume reductions in the prefrontal regions are related to general psychopathology and that volumetric reductions in the limbic regions (amygdala, hippocampus, and insula) are associated with internalizing but not externalizing factors.9 However, a longitudinal study found no alterations in the hippocampal or prefrontal regions in relation to internalizing or externalizing behaviors, although it did find that smaller amygdala volumes in adolescent males were related to greater early childhood externalizing behavior.10 A recent study reported an association between higher parent-reported aggression scores and reduced hippocampal volume in a follow-up analysis but not at baseline, suggesting that this relationship is driven by the trajectory of hippocampal development during adolescence.7
Studies indicate that SES is associated with health, cognitive abilities, academic performance, brain development, and socioemotional outcomes in children and adolescents.11-16 Adolescents with low SES have less access to the resources and experiences of those with high SES, putting them at risk for developmental and behavioral problems.17 A number of studies have demonstrated an association between SES and behavioral and brain development.18-21 SES plays a crucial role in the growth and maturation of brain structure,22 with lower total grey matter,23 frontal lobe (orbitofrontal cortex and cingulate),24 and parietal lobe volumes,25 as well as reduced cortical thickness.26 Volumetric changes in the hippocampus27,28 and amygdala have been observed to vary according to SES status.29,30 Studies on typically developing children have found that lower SES predicts a smaller hippocampus26,27,31,32 and amygdala,31 and that low SES is associated with a reduction in grey matter volumes in the frontal and temporal regions.9 Furthermore, associations have been demonstrated between family conflict and hippocampal functional connectivity33 and volume, with parental rejection being associated with lower hippocampal volume in adulthood.34
Studies on Brazilian youth have examined similar constructs, including SES, parenting practices, child behavior,35 psychopathology,36 and externalizing/internalizing behaviors.37 Altafim et al.35 investigated the relationship between SES, parenting practices, and child behavior problems in a sample of 204 Brazilian mothers with children aged 3 to 8 years, finding that lower SES was associated with more negative parenting practices and a higher incidence of internalizing problems in children.35 Gallo et al.36 analyzed data from 3,715 participants in a birth cohort study in Pelotas, Brazil. Perinatal SES data were collected at birth, and depressive symptoms were assessed when participants were 18 years old.36 The study identified several SES-related risk factors for depression in both males and females, including maternal smoking during pregnancy, low maternal education, and low family income.36 For girls, additional risk factors included having a young mother, while for boys, depression was associated with non-White maternal race and maternal mental health problems.36 These findings highlight the role of SES in increasing vulnerability to depression, particularly among girls exposed to early-life adversity. Biazoli et al.37 used data from the Brazilian High-Risk Cohort Study for Psychiatric Disorders in Childhood (BHRC) to examine the relationship between SES, brain function, and emotional and behavioral outcomes in school-age children. The study included 655 children aged 7 to 12 years from public schools in São Paulo. Resting-state functional magnetic resonance imaging (MRI) data revealed a negative correlation between spontaneous brain activity in the right superior temporal gyrus and internalizing behaviors.37 Additionally, higher SES was associated with increased activity in this brain region, which is involved in emotional regulation, suggesting that children from higher SES backgrounds may be at lower risk for internalizing problems such as anxiety and depression.37 However, these studies have not examined how these variables interact to influence brain structure or how they may moderate the relationship between socioeconomic factors and child behavior.
Families with lower SES often face challenges, such as financial instability, limited resources, and social isolation, which can increase family conflict and negatively impact children's emotional and behavioral outcomes.38 However, despite these hardships, many low-income families build strong social networks that provide emotional support and a sense of community. These networks can foster resilience, improve mental health, and offer coping strategies, highlighting the complex nature of low SES.39
Given these considerations, we hypothesized that baseline family conflict (focal predictor) would be associated with externalizing /internalizing behaviors and neuroimaging outcomes in follow-up (i.e., an a priori hypothesis of hippocampal and amygdala volume change). Additionally, we expected SES to act as a potential moderator, with stronger effects observed in families with lower SES. This suggests that the negative impact of an adverse family environment would be more pronounced among those with lower SES. Therefore, we hypothesized that there would be an interaction between family conflict and SES concerning hippocampus and amygdala volumes, as well as externalizing/internalizing behaviors.
METHODS
Participants
We included 714 participants (5-14 years old; mean age: 9.92 years; 57.6% males) who underwent brain MRI and had complete data for the 11 variables required for the covariance model. These participants were drawn from a larger cohort (the BHRC) focused on school-age children.40 The study involved students from 57 schools in the cities of São Paulo and Porto Alegre. On each school's registration day, we invited the biological parents of 6- to 12-year-old children to participate in the study.
Biological parents, predominantly mothers (87.3% of cases), from 8,012 families (representing 9,937 children) completed the family history screening test.41 The BHRC was created by combining the two strata (n=2,511). The first stratum, "the random group" (n=958), comprised randomly selected individuals. The second stratum, "the high-risk group" (n=1,553), included children at risk for psychopathology, selected using a validated prioritization algorithm.40 Only one child per family was included. Details regarding the cohort recruitment, data collection procedures, and the methodological approach have been described previously.37,40,42,43
Materials
The parents completed the Child Behavior Checklist (CBCL)44 and the Family Environment Scale (FES).45 Behavioral and emotional problems were assessed using the validated Brazilian version of the CBCL,46 which allows and assessment of dimensions of psychopathology that have shown to be valid in several cultures. Two summary scores were computed based on the CBCL scores: internalizing (summarizing the anxious/depressed, withdrawn/depressed, and somatic complaint scores; range 0-55) and externalizing (summarizing the rule-breaking and aggressive behavior scores; range 0-51). Wagner et al.47 provided psychometric evidence for the validity of this measure.
Family functioning was measured using the complete Brazilian version of the FES,48 which consists of six subscales across three domains: 1) interpersonal relationships (cohesion, expressivity, and conflict subscales); 2) personal growth (achievement-oriented subscale); and 3) system maintenance (control and organization subscales). Our analysis focused specifically on the conflict subscale.
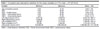
The Brazilian SES scale, developed by the Associação Brasileira de Empresas de Pesquisa (Brazilian Association of Research Enterprises),49 was used to define SES (the scores were directly and positively correlated with SES). This scale is the conventional and official method for SES stratification in Brazil, assessing estimated income, access to goods and services (regularly reviewed to reflect the national experience), and parental educational status. Scores range from 0-46. For reference in terms of SES groups and their relation to the continuous scores and respective income, we present the mean estimated median family income by SES group (SD) based on the currency rate as of January 2, 2012: 1) USD 1,087.5 (SD, 797.3) for those with low SES (classes E and D; scores 0-13); 2) USD 1,423.9 (SD, 772.3) for those with mid-level SES (classes C and B; scores 14-34); and 3) USD 2,450.6 (SD, 1,725.0) for those with high SES (class A; scores 35-46). Our sample's scores ranged from 6-36 (average 18.27; SD, 4.23) (Table 1).
| Variable | Minimum | Maximum | Mean ± SD |
|---|---|---|---|
| Age at baseline (years) | 5.83 | 14.34 | 9.92±1.85 |
| SES | 6.00 | 36.00 | 18.21±4.37 |
| FES - Conflict Score | 0.00 | 10.00 | 3.44±2.23 |
| CBCL - Internalizing Score | 0.00 | 55.00 | 13.79±9.78 |
| CBCL - Externalizing Score | 0.00 | 51.00 | 12.93±10.14 |
| Left hippocampus (mm3) | 2,501.00 | 5,090.00 | 3,818.76±366.11 |
| Right hippocampus (mm3) | 2,536.00 | 5,159.20 | 3,918.59±374.71 |
| Left amygdala (mm3) | 832.90 | 2,114.30 | 1,459.95±196.14 |
| Right amygdala (mm3) | 879.80 | 2,464.80 | 1,574.46±214.04 |
| Intracranial volume (mm3) | 919,993.00 | 1,864,950.00 | 1,394,864.48±131,792.09 |
CBCL = Child Behavior Checklist; FES = Family Environment Scale; SES = socioeconomic status.
MRI was performed using a 1.5T MRI scanner (GE Sigma HDX and GE Sigma HD, GE Healthcare, Chicago, IL, USA) at two sites (São Paulo and Porto Alegre). Both systems followed the same protocols, and MRIs were performed with the following T1-weighted image parameters: TR = 10.916 ms, TE = 4.2 ms, thickness = 1.2 mm, flip angle = 15°, NEX = 1, matrix size = 256 × 192, FOV = 245 mm, and bandwidth = 122.109, yielding 156 axial slices. Image processing and analyses were performed using an automated, unbiased, atlas-based Bayesian segmentation method in FreeSurfer 5.1.50 Volumes of the four subcortical structures (amygdala and hippocampus) were extracted using FreeSurfer. Due to the sensitivity of brain MRI signals and segmentation algorithms to artifacts such as head movement and tilt,51,52 we conducted a visual quality control inspection of the extracted volumes and hippocampal segmentation for all outliers. As a result, we excluded four subjects from the analysis. We controlled for intracranial volume, age, and sex in all analyses.
The SES and the FES scales were applied at baseline, whereas the CBCL and the MRI scan were performed at the follow-up evaluation 3 years after baseline.
Statistical analysis
Based on the hypotheses, multiple analyses of variance were used to evaluate the effects of the family conflict score (the focal predictor) and SES (the potential moderator) on the follow-up outcomes of CBCL internalizing and externalizing factor scores and on imaging results in four brain areas: the right/left hippocampus and right/left amygdala, adjusting for sex, age, and intracranial volume in all analyses. We opted for multivariate analysis of variance over multiple univariate approaches because multivariate tests more accurately capture the complex interrelated nature of our research questions, which involve modelling a combination of neuroimaging and behavioral scales that share variance and covary.53,54 We constructed a model incorporating interaction terms between SES and family conflict for the four outcomes to examine the potential moderating effect of SES. We hypothesized that more detrimental family contexts might exacerbate the direct impact of poverty on brain and behavior, leading to more deleterious effects. Conversely, a healthy family environment could act as a protective factor, mitigating the deleterious effects of poverty on neurodevelopmental outcomes. This moderating approach does not assume causal directionality55 among SES, family environment, the brain, and behavioral outcomes because both the main predictor and outcomes were not collected at the two time points, which would at least have allowed us to apply the Granger causality test. Moreover, our framework is based on an ordinary regression approach, not the average moderated treatment effect under the potential outcomes' framework and its recent developments.56
Modelling CBCL and neuroimaging measures simultaneously as outcomes mitigated multiple testing, reducing the false discovery rate. One strength of testing this hypothesis using two time points from the BHRC data was that data on the focal predictor (family conflict) and the moderator (SES) were collected at baseline. However, behavioral and neuroimaging outcomes were assessed at different time points.
A sensitivity analysis determined the robustness of the estimates under "missingness," which was expected in the longitudinal design. We assumed that missing mechanisms were missing at random and used full-information maximum likelihood to deal with missingness among the variables in the follow-up (outcomes) and baseline (predictor and moderator) measures.
Complete-case analyses using IBM SPSS Statistics determined effect sizes based on the partial eta square. Missing data analysis under full-information maximum likelihood was conducted using Mplus.57
Ethics statement
The ethics committees of the participating institutions approved all procedures. Written informed consent was obtained from all participants and their parents or guardians.
RESULTS
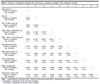
Table 1 presents the descriptive statistics of the continuous variables. In terms of SES, 16.7% (n=753) were classified as strata A/B and 72.4% (n=3,273) and 10.9% (n=495) were classified as strata D and E, respectively. Table 2 shows the Pearson correlations between the continuous variables included in the statistical models.
| 1 | 2 | 3 | 4 | 5 | 6 | 7 | 8 | 9 | 10 | |
|---|---|---|---|---|---|---|---|---|---|---|
| Age (years) (1) | ||||||||||
| Pearson correlation | 1 | |||||||||
| Sig. (2-tailed) | ||||||||||
| SES (2) | ||||||||||
| Pearson correlation | 0.031 | 1 | ||||||||
| Sig. (2-tailed) | 0.41 | |||||||||
| FES: conflict score (3) | ||||||||||
| Pearson correlation | 0.037 | -0.152** | 1 | |||||||
| Sig. (2-tailed) | 0.33 | <0.01 | ||||||||
| CBCL Neuro: internalizing (4) | ||||||||||
| Pearson correlation | 0.062 | -0.135** | 0.242** | 1 | ||||||
| Sig. (2-tailed) | 0.10 | < 0.01 | < 0.01 | |||||||
| CBCL Neuro: externalizing (5) | ||||||||||
| Pearson correlation | 0.061 | -0.134** | 0.355** | 0.591** | 1 | |||||
| Sig. (2-tailed) | 0.11 | < 0.01 | < 0.01 | < 0.01 | ||||||
| Left hippocampus (6) | ||||||||||
| Pearson correlation | 0.181** | 0.081* | -0.074* | -0.006 | -0.044 | 1 | ||||
| Sig. (2-tailed) | < 0.01 | 0.03 | 0.05 | 0.87 | 0.24 | |||||
| Right hippocampus (7) | ||||||||||
| Pearson correlation | 0.177** | 0.068 | -0.060 | 0.001 | -0.047 | 0.833** | 1 | |||
| Sig. (2-tailed) | < 0.01 | 0.07 | 0.11 | 0.97 | 0.21 | < 0.01 | ||||
| Left amygdala (8) | ||||||||||
| Pearson correlation | 0.182** | 0.067 | -0.070 | -0.118** | -0.124** | 0.567** | 0.571** | 1 | ||
| Sig. (2-tailed) | < 0.01 | 0.07 | 0.06 | <0.01 | <0.01 | < 0.01 | < 0.01 | |||
| Right amygdala (9) | ||||||||||
| Pearson correlation | 0.206** | 0.046 | -0.036 | -0.066 | -0.065 | 0.565** | 0.581** | 0.776** | 1 | |
| Sig. (2-tailed) | < 0.01 | 0.21 | 0.34 | 0.08 | 0.08 | < 0.01 | < 0.01 | < 0.01 | ||
| Intracranial volume (10) | ||||||||||
| Pearson correlation | 0.210** | 0.049 | -0.030 | -0.036 | -0.064 | 0.624** | 0.620** | 0.588** | 0.588** | 1 |
| Sig. (2-tailed) | < 0.01 | 0.19 | 0.42 | 0.33 | 0.09 | < 0.01 | < 0.01 | < 0.01 | < 0.01 |
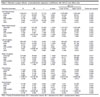
Pillai's trace showed that of the two main predictors (SES and family conflict scores), only family conflict was a significant predictor (Fconflict [6,703] = 15.664, p < 0.001, ?2 = 0.118). Sex, age, and intracranial volume (covariates) were also significant: Fsex (6,703) = 7.698, p < 0.001, ?2 = 0.062); Fage (6,703) = 3.446, p = 0.002, ?2 = 0.029; and Ficv (6,703) = 79.787, p < 0.001, ?2 = 0.405, respectively.
Between-subject analyses revealed significant associations between externalizing (beta = 1.511 standard error = 0.160, p < 0.001, ?2 = 0.112) and internalizing (beta = 0.989, standard error = 0.160, p < 0.001, ?2 = 0.051) behavior and family conflict. This indicates that greater family conflict predicted higher externalizing and internalizing behavior scores during follow-up.
There was no evidence of an association between family conflict and SES with the four neuroimaging outcomes. Information regarding between-subject effects is presented in Table 3.
| 95% CI | |||||||
|---|---|---|---|---|---|---|---|
| Outcome/covariates | B | SE | t | p-value | Lower bound | Upper bound | Partial eta squared |
| Left hippocampus | |||||||
| Intercept | 1.336.414 | 131.372 | 10.173 | < 0.001 | 1.078.488 | 1.594.340 | 0.128 |
| Male | 13.753 | 23.826 | 0.577 | 0.564 | -33.024 | 60.531 | 0.000 |
| Age | 11.647 | 5.943 | 1.960 | 0.050 | -0.022 | 23.316 | 0.005 |
| FES conflict | -8.778 | 4.850 | -1.810 | 0.071 | -18.300 | 0.744 | 0.005 |
| ICV | 0.002 | 9.151E-05 | 18.238 | 0.000 | 0.001 | 0.002 | 0.320 |
| SES | 3.347 | 2.477 | 1.352 | 0.177 | -1.515 | 8.210 | 0.003 |
| Right hippocampus | |||||||
| Intercept | 1.413.081 | 135.183 | 10.453 | < 0.001 | 1.147.673 | 1.678.489 | 0.134 |
| Male | 24.399 | 24.517 | 0.995 | 0.320 | -23.735 | 72.534 | 0.001 |
| Age | 12.687 | 6.116 | 2.074 | 0.038 | 0.679 | 24.694 | 0.006 |
| FES conflict | -7.034 | 4.991 | -1.409 | 0.159 | -16.832 | 2.764 | 0.003 |
| ICV | 0.002 | 9.417E-05 | 17.850 | < 0.001 | 0.001 | 0.002 | 0.310 |
| SES | 2.479 | 2.549 | 0.973 | 0.331 | -2.524 | 7.483 | 0.001 |
| Left amygdala | |||||||
| Intercept | 290.432 | 71.822 | 4.044 | < 0.001 | 149.423 | 431.441 | 0.023 |
| Male | 62.210 | 13.026 | 4.776 | < 0.001 | 36.637 | 87.784 | 0.031 |
| Age | 8.279 | 3.249 | 2.548 | 0.011 | 1.899 | 14.658 | 0.009 |
| FES conflict | -5.168 | 2.651 | -1.949 | 0.052 | -10.374 | 0.037 | 0.005 |
| ICV | 0.001 | 5.003E-05 | 15.004 | < 0.001 | 0.001 | 0.001 | 0.241 |
| SES | 1.221 | 1.354 | 0.902 | 0.368 | -1.438 | 3.879 | 0.001 |
| Right amygdala | |||||||
| Intercept | 274.930 | 78.598 | 3.498 | < 0.001 | 120.616 | 429.243 | 0.017 |
| Male | 61.697 | 14.255 | 4.328 | < 0.001 | 33.711 | 89.683 | 0.026 |
| Age | 11.703 | 3.556 | 3.291 | 0.001 | 4.722 | 18.685 | 0.015 |
| FES conflict | -2.723 | 2.902 | -0.938 | 0.348 | -8.420 | 2.974 | 0.001 |
| ICV | 0.001 | 5.475E-05 | 15.030 | < 0.001 | 0.001 | 0.001 | 0.242 |
| SES | 0.516 | 1.482 | 0.348 | 0.728 | -2.393 | 3.425 | 0.000 |
| Internalizing | |||||||
| Intercept | 11.343 | 4.325 | 2.622 | 0.009 | 2.851 | 19.834 | 0.010 |
| Male | -1.987 | 0.784 | -2.534 | 0.012 | -3.528 | -0.447 | 0.009 |
| Age | 0.461 | 0.196 | 2.355 | 0.019 | 0.077 | 0.845 | 0.008 |
| FES conflict | 0.989 | 0.160 | 6.196 | < 0.001 | 0.676 | 1.303 | 0.051 |
| ICV | -1.159E-07 | 3.013E-06 | -0.038 | 0.969 | -6.031E-06 | 5.800E-06 | 0.000 |
| SES | -0.232 | 0.082 | -2.843 | 0.005 | -0.392 | -0.072 | 0.011 |
| Externalizing | |||||||
| Intercept | 15.766 | 4.339 | 3.634 | < 0.001 | 7.247 | 24.285 | 0.018 |
| Male | 1.276 | 0.787 | 1.622 | 0.105 | -0.269 | 2.821 | 0.004 |
| Age | 0.489 | 0.196 | 2.490 | 0.013 | 0.103 | 0.874 | 0.009 |
| FES conflict | 1.511 | 0.160 | 9.435 | < 0.001 | 1.197 | 1.826 | 0.112 |
| ICV | -7.229E-06 | 3.023E-06 | -2.392 | 0.017 | -1.316E-05 | -1.295E-06 | 0.008 |
| SES | -0.194 | 0.082 | -2.377 | 0.018 | -0.355 | -0.034 | 0.008 |
FES = Family Environment Scale; ICV = intracranial volume; SE = standard error; SES = socioeconomic status.
Furthermore, Pillai's trace showed no evidence that the association of FES conflict score and SES had a moderating effect on neuroimaging outcomes (Fconflict*SES [6,702] =1.004, p = 0.422, ?2 = 0.009). Thus, there is no evidence that FES conflict scores have a conditional effect on neuroimaging outcomes according to different SES values.
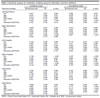
Sensitivity analysis under full-information maximum likelihood, in which the number of analyzed cases was 2,501, also indicated no evidence that there was an interaction between SES and FES conflict scores. Moreover, the association between FES conflict, externalization, and internalization was preserved. Table 4 presents the standardized coefficients for the conditional and unconditional models using 2,501 participants.
| Conditional model | Unconditional model | |||||
|---|---|---|---|---|---|---|
| Outcome/covariates | Standardized beta | SE | p-value | Standardized beta | SE | p-value |
| Left hippocampus | ||||||
| Sex | -0.017 | 0.031 | 0.583 | 0.006 | 0.025 | 0.818 |
| Age | 0.059 | 0.030 | 0.047 | 0.038 | 0.025 | 0.132 |
| SES | -0.010 | 0.052 | 0.844 | 0.032 | 0.024 | 0.181 |
| FES conflict | -0.193 | 0.113 | 0.087 | -0.055 | 0.030 | 0.064 |
| ICV | 0.589 | 0.035 | < 0.001 | 0.625 | 0.020 | < 0.001 |
| Interaction (SES*FES) | 0.150 | 0.120 | 0.210 | 0.006 | 0.025 | 0.818 |
| Right hippocampus | ||||||
| Sex | -0.028 | 0.031 | 0.363 | -0.012 | 0.025 | 0.626 |
| Age | 0.061 | 0.030 | 0.039 | 0.042 | 0.025 | 0.089 |
| SES | -0.042 | 0.050 | 0.400 | 0.024 | 0.024 | 0.305 |
| FES conflict | -0.233 | 0.107 | 0.030 | -0.046 | 0.029 | 0.111 |
| ICV | 0.571 | 0.039 | < 0.001 | 0.627 | 0.020 | < 0.001 |
| Interaction (SES*FES) | 0.206 | 0.113 | 0.069 | - | - | - |
| Left amygdala | ||||||
| Sex | -0.163 | 0.035 | 0.000 | -0.179 | 0.027 | < 0.001 |
| Age | 0.082 | 0.032 | 0.011 | 0.071 | 0.026 | 0.006 |
| SES | 0.044 | 0.056 | 0.434 | 0.029 | 0.025 | 0.247 |
| FES conflict | -0.023 | 0.131 | 0.858 | -0.052 | 0.030 | 0.076 |
| ICV | 0.522 | 0.030 | < 0.001 | -0.179 | 0.024 | < 0.001 |
| Interaction (SES*FES) | -0.039 | 0.137 | 0.778 | 0.545 | 0.027 | < 0.001 |
| Right amygdala | ||||||
| Sex | -0.148 | 0.034 | < 0.001 | -0.167 | 0.026 | < 0.001 |
| Age | 0.108 | 0.032 | 0.001 | 0.086 | 0.025 | 0.001 |
| SES | 0.058 | 0.054 | 0.287 | 0.021 | 0.024 | 0.396 |
| FES conflict | 0.100 | 0.126 | 0.425 | -0.023 | 0.029 | 0.425 |
| ICV | 0.515 | 0.035 | < 0.001 | 0.563 | 0.023 | < 0.001 |
| Interaction (SES*FES) | -0.140 | 0.130 | 0.281 | -0.167 | 0.026 | < 0.001 |
| Internalizing | ||||||
| Sex | 0.108 | 0.038 | 0.005 | 0.102 | 0.030 | 0.001 |
| Age | 0.087 | 0.037 | 0.017 | 0.139 | 0.030 | < 0.001 |
| SES | -0.138 | 0.067 | 0.040 | -0.111 | 0.029 | < 0.001 |
| FES conflict | 0.178 | 0.147 | 0.227 | 0.221 | 0.034 | < 0.001 |
| ICV | 0.001 | 0.040 | 0.982 | 0.010 | 0.032 | 0.747 |
| Interaction (SES*FES) | 0.047 | 0.158 | 0.764 | 0.102 | ||
| Externalizing | ||||||
| Sex | -0.069 | 0.036 | 0.054 | -0.060 | 0.030 | 0.043 |
| Age | 0.083 | 0.035 | 0.017 | 0.112 | 0.030 | < 0.001 |
| SES | -0.065 | 0.065 | 0.314 | -0.111 | 0.028 | < 0.001 |
| FES conflict | 0.389 | 0.116 | 0.001 | 0.327 | 0.033 | < 0.001 |
| ICV | -0.096 | 0.038 | 0.011 | -0.055 | 0.033 | 0.093 |
| Interaction (SES*FES) | -0.088 | 0.142 | 0.536 | -0.060 | - | - |
SFES = Family Environment Scale; ICV = intracranial volume; SE = standard error; SES = socioeconomic status.
DISCUSSION
We examined the associations between SES, child-family conflict, externalizing/internalizing behaviors, and bilateral hippocampus and amygdala volumes. Additionally, we examined the moderating effects of SES on the associations between family conflict, externalizing/internalizing behaviors, and brain structures. Family conflict emerged as a predictor of externalizing/internalizing behaviors in children during follow-up. Our findings corroborate those of previous studies conducted with Brazilian children regarding the connections between family conflict and externalizing/internalizing behaviors in children.35,36
Our results showed that family conflict had a substantial effect on internalizing and externalizing behavior (the effect being greater on externalizing behavior) but not on subcortical brain structure volumes. Studies investigating parenting from early toddlerhood to adolescence have typically emphasized the quality of parenting behavior, concentrating on parental warmth, hostility or conflict, and control. Among these dimensions, parental hostility is most associated with adverse neurodevelopmental outcomes in children, including externalizing/internalizing behaviors and poorer executive function.58 Two meta-analyses reported a robust association between conflictive and hostile/aggressive parent-child relationships and externalizing behaviors in children and adolescents.59 Moreover, a parent effects model, which is described as conflictual or negative parenting that results in and/or exacerbates child or adolescent externalizing behavior, has been reported as responsible for this association.60 In this context, our results on the association between family conflict and externalizing/internalizing behaviors support these findings.
The neural correlates of SES have been consistently addressed by studies investigating brain structure and mental health in adults and children. In contrast to previous studies,61 we did not find sufficient evidence that SES affects youth developmental outcomes. Ursache et al.62 pointed out that although understanding of the relationship between SES and brain and developmental outcomes has improved, there is still no consensus on the definition and conceptualization of the SES construct. Although we used a conventional Brazilian SES assessment, which was appropriate for our cultural construct, it limits comparison with other countries.
For instance, a large study of 2,043 children aged 11-13 years found that although low SES was associated with childhood mental health problems, this association was modified by parental emotional well-being and parenting practices.63 A systematic review17 showed that the impact of low SES is more pronounced in early childhood than in adolescence, and lower SES was more strongly associated with externalizing disorders than internalizing disorders. We found a minimal association between SES and externalizing/internalizing behaviors (r = -0.134). This weak relationship might be attributable to the instrument we used to measure SES, which, while appropriate for the culture in which the data were collected, limits the generalizability of the findings to broader populations and cultures. Additionally, SES was assessed only at baseline and not during the 3-year follow-up, meaning we cannot assume that SES remained stable throughout this period. The fact that this measure was not assessed longitudinally could further weaken the observed relationship between SES and behavioral outcomes. Despite these limitations, our study contributes to the global understanding of child and youth neurodevelopment by supporting previous findings in a Brazilian sample and offering new insights for future cross-cultural and cross-national research.
Internalizing and externalizing behaviors have been implicated in the development of numerous psychopathologies, such as disruptive behavior disorders,64 substance abuse,65,66 ADHD,67 autism spectrum disorder,68 etc. As mentioned earlier, the windows of vulnerability observed in adolescence are critical for brain development and, although the results of the present study showed no association with brain measures, the fact that our analyses were conducted on a very young population (mean age: 11.2 years) must be considered. We cannot disregard the possibility that brain alterations may appear later in life, since hippocampal reductions and other structural brain alterations associated with mental illness have been commonly observed in adult populations.69
Furthermore, our study showed the influence of family conflict on the behavior of children, shedding some light on the mechanisms involved in the association between psychopathology and behavioral symptoms, highlighting the need for interventions that target not only the children or adolescents affected by family conflict but provide parental training and education as well. For example, a systematic review70 showed that three different parental behavior training programs were quite efficacious for externalizing and internalizing symptoms in children and adolescents with disruptive behavior disorders, reinforcing the relevance of studies that seek a better understanding of the environmental factors involved in neurodevelopmental disorders.
Future directions in the field could involve innovative testing and robust models to determine whether behaviors change over time for a continuous outcome, such as externalizing scores (via latent change score), or a categorical approach in which latent homogenous groups of behaviors (via latent transition analysis) could be predicted by external factors, such as family conflict. Moreover, the synchronicity between changes in behavior and neuroimaging indicators could be tested for both outcomes through repeated measures over time.71 One limitation is that the scanner sites (one each in São Paulo and Porto Alegre) were not considered to reduce model complexity in multilevel data analysis. Moreover, it is important to note that SES will likely be underestimated if observations within clusters are correlated (i.e., if there is an intra-cluster correlation for neuroimaging and CBCL scores). However, the point estimates (coefficients) are usually unaffected - clustering mainly affects standard error, not the estimated effects (the reported effect sizes). Therefore, the effect sizes are still trustworthy. However, if the model is misspecified (e.g., omitting cluster-level fixed/random effects), the coefficients could also be biased.
In conclusion, brain developmental trajectories are affected by biological and environmental factors throughout childhood and adolescence. The impact of the family environment and SES on brain structure and mental health appears undeniable. Our findings are consistent with emerging evidence on an association between family conflict and externalizing/internalizing behavior in youth. It is important to consider that neurodevelopment is influenced not only by these windows of vulnerability but also by windows of opportunity that could buffer and ameliorate negative developmental outcomes. Understanding both developmental hazards and buffering effects on developmental trajectories warrants further attention in future studies regarding both prevention and intervention efforts in psychopathology, as well as determining the effects of low SES for social policy.
ACKNOWLEDGEMENTS
This study was mainly funded by Fundação de Amparo à Pesquisa do Estado de São Paulo (FAPESP; process 15/50469-0) and in part by Coordenação de Aperfeiçoamento de Pessoal de Nível Superior (CAPES; Finance Code 001).
AZ has received funding from Coordenação de Aperfeiçoamento de Pessoal de Nível Superior/Conselho Nacional de Desenvolvimento Científico e Tecnológico and the National Institute of Mental Health /National Institutes of Health outside the scope of this work.
 PDF
 Print
 Send this article by email
 How to cite this article
 Submit a comment
 Mendeley
 Pocket
 Share on Facebook
 Share on Twitter