



ABSTRACT:
OBJECTIVE: Ultra-high risk criteria were developed to identify prodromal symptoms of psychosis,
although the transition does not occur in most individuals. This highlights the need
to identify transition markers, such as movement analysis. In the first stage of our
study, movement analysis was used to differentiate controls from ultra-high risk patients,
who had reduced movement and increased erraticism. We aimed to determine whether these
variables can predict ultra-high risk outcomes after follow-up.
METHODS: Ultra-high risk individuals were recorded while performing two speech tasks at baseline.
The videos were analyzed using motion energy analysis for head and torso movements
(mean amplitude, frequency, and variability) and were manually coded for gesticulation.
During follow-up, seven participants transitioned to psychosis, 21 to other DSM-5
disorders (called the general disorder group), and 18 did not transition to psychosis.
RESULTS: The general disorders group showed lower torso frequency and higher variability in
both regions than the psychosis group, as well as greater torso variability than the
non-transition group. No differences were found between the psychosis and non-transition
groups. Gesticulation did not significantly differ between groups.
CONCLUSIONS: Baseline movement variability distinguishes ultra-high risk transition outcomes, with
higher variability in those who transitioned to non-psychotic disorders. This demonstrates
the importance of movement analysis as a potential transition marker and suggests
that treating ultra-high risk individuals as a single group may overlook important
information.
Keywords: Ultra-high risk; motion energy analysis; gestures; movement analysis; transition markers.
FIGURES
| Note: How to cite this article: Lopes-Rocha AC, Corcoran CM, Argolo F, Jafet AF, Ara A, Gondim JM, et al. Automated movement analysis predicts transition to non-psychotic disorders in individuals at ultra-high risk for psychosis. Braz J Psychiatry. 2025;47:e20243919. http://doi.org/10.47626/1516-4446-2024-3919 |
| Received: November 20 2024; Accepted: April 03 2025 |
INTRODUCTION
Ultra-high risk (UHR) for psychosis is one of the most studied preventive paradigms in psychiatry,1 being used to identify pre-clinical stages of schizophrenia spectrum disorders and to promote early intervention. Despite the growing evidence supporting the validity of the UHR paradigm, less than one third of these individuals transition to a psychosis syndrome within 2 years.2 Investigation of the UHR paradigm has indicated, first, that psychosis has a heterotypic course, and second, that transition markers should be identified through different approaches.
Recent studies have discussed the importance of investigating these criteria not only to predict psychosis syndrome but to detect early stages of general psychiatric diagnoses.3 A systematic review found that 28 to 71% of UHR individuals who did not transition to psychosis (NT) did not remit from at-risk status and 22 to 82% met the criteria for at least one non-psychotic clinical diagnosis.4 According to a meta-analysis of 28 studies (mean follow-up of 30.7 months), although UHR individuals who did not transition to psychosis had better clinical outcomes, less than half actually remitted from at-risk status over this period.5 A naturalistic study that followed 160 NT individuals found that 54.5% met the criteria for at least one Axis-I diagnosis, mainly anxiety and affective disorder.6
Over the years, techniques such as electroencephalography,7 gene expression,8 and social/cognitive analysis9,10 have been widely used in the search for biomarkers, as well as the development of risk calculators.11,12 However, most of these approaches require various tests, some of which are invasive.
Predicting psychosis through movement analysis
Movement analysis has been used in the search for transition markers in UHR individuals. A recent study employed automated motion energy analysis (MEA) software13 to capture movement during diagnostic interviews, finding greater speed, greater total body movement, and lower movement variation in the UHR group (54 individuals) than healthy controls (62 individuals).14 Another study assessed movement abnormalities through videos taken during clinical interviews and a dyskinesia identification scale, finding that individuals with schizotypal personality disorder had more motor abnormalities in the face and upper body than psychiatric patients and healthy controls.15 In adolescents with schizotypal personality disorder, movement impairments were also found to increase over time.16 Another study that recorded videos during clinical diagnosis found higher abnormal involuntary movement scores in a UHR (45 individuals) and first-episode psychosis (10 individuals) group than in a non-psychotic/non-UHR control group (39 individuals).17
Using a force platform, a study observed greater postural sway in a UHR group (43 individuals) than in healthy controls (44 individuals), which predicted negative symptom progression18 and was associated with decreased beat gestures in these individuals.19 Some movement impairments found in UHR individuals include lower overall gesticulation and a higher number of mismatch gestures (incongruence between the current gesture and speech content) and retrieval gestures (more gestures performed during pauses in speech).20,21
A study that assessed 40 UHR adolescents with a dyskinesia scale over 4 years found that those who transitioned to a DSM-5 diagnosis of psychosis (10 individuals) had greater movement abnormalities at baseline than the NT group (30 individuals).22 Another longitudinal analysis, part of the Enhancing the Prospective Prediction of Psychosis (PREDICT) study, assessed 148 UHR individuals with the Abnormal Involuntary Movement Scale, finding that the 28 who transitioned to a psychotic disorder had greater spontaneous dyskinesia at baseline.23 Thus, the use of movement analysis in UHR could be an important ally in the search for psychosis prediction markers.
The present study
In previously published studies, we attempted to understand how movement could differentiate UHR individuals from healthy controls in a medication-naïve population sample. To do this, we recorded videos collected during free-speech tasks (in an attempt to assess variables more naturalistically), submitting them to two different types of analysis: MEA and gesticulation assessment.24,25 Using MEA to assess the total amount of movement, the UHR group was observed to have a lower mean amplitude of head movement and higher head and torso movement variability than controls.24 Although there were no significant differences between the groups regarding gestures, there were negative correlations with prodromal symptoms and positive correlations with total movement.25 In summary, these cross-sectional analyses indicated the presence of movement abnormalities in a population of UHR individuals.
During follow-up of this sample, three groups were determined according to outcome: those who transitioned to psychosis (the psychosis group), those who transitioned to a DSM-V non-psychotic syndrome (referred to as the general disorder [GD] group), and those who did not transition to a DSM-V diagnosis (the NT group). The present study investigated whether baseline movement patterns could predict transition to psychosis or other outcomes among UHR individuals. To do this, we used data collected from the baseline videos to determine whether the MEA and gesture variables differed between the three outcome groups. We hypothesized that NT, psychosis, and GD groups (i) differ in relation to MEA variables, (i.e., mean amplitude, movement frequency, and coefficient of variability) and (ii) in relation to in gestures and self-stimulation movements.
METHODS
Sample and procedures
The Subclinical Symptoms and Prodromal Psychosis (SSAPP) Project,26 of which this study is a part, is a population-based cohort study based on three waves of general population screenings in São Paulo, Brazil (2016-2017, 2021, and 2022). Over 6,000 individuals aged 18-35 years were interviewed using the Prodromal Questionnaire-Brief version and a 9-item scale of perceptual and cognitive aberrations developed to assess basic symptoms, adhering to previously published screening procedures.25,26 The Prodromal Questionnaire-Brief version, a shortened version of the Prodromal Questionnaire, consists of 16 items on positive psychotic experiences and is used to screen for UHR.27 The 9-item basic symptoms scale investigates self-experienced disturbances in perception and cognition that manifest in the early stages of psychosis risk states.28
Individuals with combined scores > 10 on these tests were invited to participate in a face-to-face interview at the Instituto de Psiquiatria, Universidade de São Paulo, in which they were assessed with the Structured Interview for Psychosis-Risk Syndromes (SIPS)29 for UHR status, and with the SCID-5, a semi-structured interview, to assess DSM-5 disorders (GD).30 SIPS diagnoses three prodromal syndromes for psychosis: brief intermittent psychotic symptom syndrome, genetic risk and deterioration syndrome, and attenuated psychosis syndrome.29 Pursuant to a medication naïve sample, all participants on medication were excluded from the study. Our baseline sample consisted of 56 individuals in the UHR group and 69 controls.25
After a mean of 30 months, the participants were recalled for a follow-up interview including reapplication of the SIPS and the SCID-5 to assess transition to a GD. In the UHR group, eight transitioned to a psychosis syndrome, 24 transitioned to a GD, and the remaining 20 were not diagnosed with a disorder (NT).
After an outlier analysis, our sample consisted of 18 in the NT group, seven in the psychosis group, and 21 in the GD group. The psychosis group included schizophrenia (n=1), psychotic depression (n=1), substance-induced psychosis (n=1), and bipolar disorder (n=4). The GD group included seven with depressive disorders alone (persistent depressive disorder, major depressive disorder, or recurrent depressive disorder), six with anxiety disorders alone (generalized anxiety disorder, social anxiety disorder, or post-traumatic stress disorder), four with both depressive and anxiety disorders (combinations of major depression, recurrent depression, and social anxiety with generalized anxiety disorder), three with substance use disorders alone (alcohol or cannabis dependence), and one with both substance use and anxiety disorders (combinations of alcohol dependence with generalized anxiety disorder).
Elicitation of speech and self-expression
As described in our previous studies,24,25 audiovisual files of two different protocols were recorded at baseline using a mobile phone placed on a support in front of each seated participant. All participants provided consent, and the study was approved by the Institutional Review Board of Universidade de São Paulo. The first protocol, which was performed at the beginning of the interview, consisted of the SIPS Subject Overview section plus asking the participants to speak freely about their childhood and relationship with their parents. The second protocol, performed after the SIPS interview, was based on Mota's paradigm,31 which included memory reports of a recent or old dream and short-term memory reports based on three positive affective pictures (baby, a puppy, and a dessert). When participants could not remember a dream, a description of the prior day was solicited. After the video was recorded, it was immediately stored in a cloud according to Brazilian data protection compliance standards (Lei Geral de Proteção de Dados; https://www.lgpdbrasil.com.br/) and was deleted from the phone.
Motion energy analysis
MEA was performed using an open-source software program based on frame-differencing methods,13 as described in a previous study.25 Movement can be assessed in predefined regions of interest, and we selected the torso (including upper body, hand, and arm movements) and the head. The intrinsic limitations of this method have been discussed by Lopes-Rocha,24 such as movements requiring transposition of the predefined regions.
Individual data were recorded to a text file, followed by preprocessing in R software and filtering with a moving average filter of 5 seconds, as per previous studies.14 The variables were defined based on Dean et al.14: the mean movement amplitude across the entire video and the coefficient of variability (SD of the movement amplitude divided by the mean movement amplitude during the entire video). Although they also analyzed the total amount of movement, given that our videos were of different durations, we used movement frequency (the sum of the frames different from zero divided by the total number of frames) to control for this issue.24
Gesticulation and self-stimulation movement analysis
The gesture analysis technique, which was based on Mittal et al.,21 is described in detail in Lopes-Rocha.25 We manually quantified the frequency of four categories of gestures (iconic, metaphorical, deictic, and beats) and we determined the total number of actions divided by speech time, the total number of actions divided by the number of self-stimulation movements, and the total number of actions divided by total video time, since it does not depend on speech for classification.
Iconic gestures literally represent the semantic content that is being spoken, while metaphorical gestures represent an abstraction in relation to the semantic content. Deictic gestures point to both concrete and abstract subjects. Beats are rhythmic movements made during speech that are not fully related to semantic content. Although not classified as gestures, self-stimulation movements are aimed at the speaker, such as touching one's own hair.
Statistical analysis
The statistical tests were performed in SPSS 25 for Mac and Jamovi 2.4.8 for Windows. Concerning demographics variables, age was presented as mean (SD), while categorical variables were expressed as frequency and percentage. Education was divided into three levels (incomplete or complete high school, an incomplete or complete undergraduate degree, and an incomplete or complete graduate degree). The Shapiro-Wilk test for normality was used to verify the distribution of each MEA variable and gesticulation and self-stimulation variables in both videos (subject overview and memory reports). Given the non-normal distribution, the Kruskal-Wallis test was used to verify differences between the psychosis, GD, and NT groups. The Dwass-Steel-Critchlow-Fligner test was performed for multiple comparison analysis.
Ethics statement
All participants provided written informed consent for this study and its data use. The study was approved by the research ethics committees of the Comissão Nacional de Ética em Pesquisa (no. 53536816.0.0000.0065) and the Faculdade de Medicina, Universidade de São Paulo (no. 36510820.3.0000.0068). The study design, implementation, and data ownership processes was developed by local researchers, and the manuscript was written with outside collaboration.
RESULTS
Sociodemographic variables were similar in the NT, psychosis, and GD groups (Table 1). The participants were aged between 20 and 44 years (mean [SD] = 30.4 [5.23] years) and more than two-thirds were women (67.4%). Because no variables were normally distributed (p < 0.05), non-parametric tests were applied.
| NT (n=18) | Psychosis (n=7) | GD (n=21) | Statistic | ? | |
|---|---|---|---|---|---|
| Age (years), mean ± SD | 30.1±5.6 | 26.9±5.7 | 31.9±4.3 | ?2 = 4.1 | 0.1 |
| Sex | 0.4 | ||||
| Female | 10 (55.6) | 5 (71.4) | 16 (76.2) | ?2 = 1.9 | |
| Male | 8 (44.4) | 2 (28.6) | 5 (23.8) | ||
| Education | |||||
| Incomplete or complete high school | 6 (33.3.) | 4 (57.1) | 6 (31.6) | ?2 = 2.7 | 0.6 |
| Incomplete or complete undergraduate degree | 10 (55.6) | 2 (28.6) | 12 (63.2) | ||
| Incomplete or complete graduate degree | 2 (11.1) | 1 (14.3) | 1 (5.3) |
Data presented as n (%), unless otherwise specified.
GD = general disorder group; NT = non-transition group.
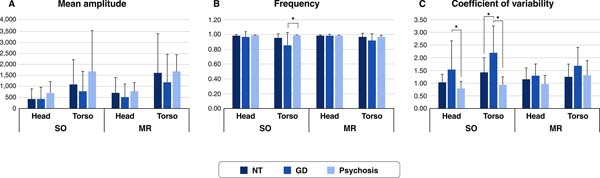
Regarding our first hypothesis about the mean movement amplitude, no differences were observed between the NT and transitioned groups. However, the frequency of torso movement in the subject overview video differed significantly between groups (?2 = 7.02, p = 0.030, ?2 = 0.163). Multiple comparison tests showed a significantly lower frequency in the GD group than the psychosis group (W = 3.41, p = 0.042), but not the NT group (Figure 1). Likewise, there were coefficient of variability differences in the subject overview video for both the head (?2 = 10.10, p = 0.006, ?2 = 0.235) and torso (?2 = 16.37, p < 0.01, ?2 = 0.380) regions, with the GD group presenting higher scores than both the psychosis (head: W = -4.09, p = 0.011; torso: W = -4.84, p < 0.002) and NT (torso: W = -3.99, p = 0.013) groups (Figure 1).
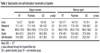
Our second hypothesis was refuted, since there were differences between the groups regarding gestures and self-stimulation movements (Table 2).
| Subject overview | Memory report | |||||||
|---|---|---|---|---|---|---|---|---|
| NT | Psychosis | GD | p-value | NT | Psychosis | GD | p-value | |
| Iconic | 1.4±2.7 | 5.8±8.9 | 1.6±3.8 | 0.4 | 9.3±17.7 | 4.9±7.8 | 7.0±15.1 | 0.9 |
| Metaphoric | 11.1±14.1 | 17.1±14.6 | 9.8±12.8 | 0.5 | 20.1±31.8 | 17.0±14.6 | 19.9±26.2 | 0.9 |
| Beat | 203.0±176.0 | 136.0±150.0 | 117.0±127.0 | 0.2 | 146.0±179.0 | 140.0±112.0 | 146.0±163.0 | 0.9 |
| Deictic | 48.4±31.3 | 24.8±21.6 | 60.5±59.0 | 0.3 | 47.8±49.1 | 19.3±44.3 | 37.8±34.6 | 0.5 |
| Self-stimulation | 31.8±29.0 | 22.5±21.6 | 20.7±20.5 | 0.5 | 25.9±23.9 | 21.5±22.1 | 25.0±33.7 | 0.7 |
Mean (SD) × 10-3.
p-value obtained through the Kruskal-Wallis test.
GD = general disorder group; NT = non-transition group.
DISCUSSION
Our study found a significant difference in baseline movement variability among medication-naïve UHR transition categories. Those who transitioned to GD had higher variability of movement than the NT group and the psychosis group. The GD group also had a lower frequency of movement than the psychosis group. Considering that the GD group mainly consisted of individuals diagnosed with anxiety and/or depression disorders, these results are consistent with the literature.
Trembling, psychomotor slowing, agitation, and movement synchrony impairments are characteristic of depression and anxiety disorders.32-34 Highly anxious patients present with more twitches, tremors, and rigid torso positions, as well as less engagement in manual signaling than less anxious patients.35 Psychomotor abnormalities in depression range from agitation to retardation (not as mutually exclusive, but as independent phenomena) according to different factors, such as the course of the illness, medication, sex, age, and time of the day.36 This agrees with our finding of higher baseline variability in the GD group (i.e., anxious and depressive patients) than the NT group.
The GD group had a higher variability and lower frequency of movement than the psychosis group. Few studies have addressed movement in different diagnostic groups, considering that the main focus is usually comparison with nonclinical subjects. Measuring eight nonverbal behavioral variables, Jones & Pansa37 found that depressed patients had a higher frequency of large and small movements of the head and more self-stimulation movements than schizophrenia patients. A study comparing nonverbal behavior in schizophrenia, depression, and mania patients found that the mania group performed more illustrative gestures than the other groups, but there were no significant differences between the schizophrenia and depression groups.38 Using the Ethological Coding System for Interviews to assess 14 behavioral aspects of interaction with the environment, researchers found more flight behavior, such as looking down or away, than those with depression, among patients with schizophrenia.39 Also using MEA software, Paulick et al.40 compared nonverbal behavior in patients with depressive and anxiety disorders, finding less movement in depressive patients than anxious patients. The limited number of studies with different outcomes makes it difficult to compare our results, but our findings align with the few studies that have found differences between psychosis and other disorders.
Motor behavior abnormalities have also been widely observed in psychosis syndromes. Schizophrenia patients, for example, have motor abnormalities more erratic and irregular gestures, and reduced head and body movement during social interaction.41,42 In bipolar disorder, psychomotor retardation or agitation can be present,43,44 although motor activity can vary according to mood episode: during the manic state, greater variability and complexity are observed in these patients than in NT patients, while lower mean activity is observed in the depressive state than the manic state.45 These motor behavior differences in schizophrenia and bipolar disorder might explain the lack of difference between our psychosis and the NT groups, given that transitions to different syndromes occurred within the psychosis group.
In our previously published data, we observed less movement and a higher coefficient of variability in youths classified as UHR than in their healthy peers,24 as well as a significant correlation with gesture categories,25 showing that movement abnormalities are present prior to the outcome. These baseline movement variables may help to predict a transition to non-psychotic disorders, which supports the idea that considering risk states as a single homogeneous group can overlook important information.
In fact, the majority of at-risk patients do not transition to a psychosis syndrome,4 and research that focuses solely on this transition can neglect other possible outcomes. After following-up NT participants, a naturalistic study found that more than half still met the criteria for at least one Axis-I diagnosis.6 A meta-analysis of 28 studies found that more than half of UHR individuals who do not transition to psychosis also did not remit from at-risk status.5 Thus, prodromal signs and symptoms used to diagnose UHR are not only associated with psychotic disorders, but with several potential outcomes as well.1 A marker of transition to non-psychotic disorders, such as the one found in the present study, could become an important feature of outcome assessment and prediction in UHR individuals.
Regarding study limitations, the first was the low sample size. The small number of individuals with each diagnosis did not allow an individualized analysis per diagnosis, so we had to divide them into three larger groups, which hinders comparison with previous studies. However, the higher variability in the GD group is consistent with findings on anxiety and depressive disorder. The lack of difference in the psychosis group might be explained by its heterogeneity, but further studies are needed to verify this hypothesis. In addition to the limitations mentioned in the first part of this study,24,25 such as those intrinsic to the methods and the fact that it was a non-helping seeking sample, our sample was greatly reduced by follow-up losses ( 62.05% attrition rate). This is high compared to other studies, in which dropouts vary from 25 to 36%,46,47 although the majority include help-seeking patients, which hinders comparison with our population-based sample.
Nevertheless, important differences were found between the groups at baseline, indicating the need for movement analysis in individuals at risk for non-psychotic disorders. Further studies should assess the evolution of these variables over time and, through intra-subject analysis, verify whether post-outcome analysis results in improved prediction capability.
ACKNOWLEDGEMENTS
This study was supported by grants from the Coordenação de Aperfeiçoamento de Pessoal de Nível Superior - Brasil (88887.625326/2021-00), the Fundação de Amparo à Pesquisa do Estado de São Paulo (grant 2014/50873-3), the Conselho Nacional de Desenvolvimento Científico e Tecnológico (grant 565412/2014-9), and the Wellcome Trust (grant 223139/Z/21/Z).
 PDF
 Print
 Send this article by email
 How to cite this article
 Submit a comment
 Mendeley
 Pocket
 Share on Facebook
 Share on Twitter