



ABSTRACT:
OBJECTIVES: Rural residents are exposed to many risk factors for poor diet quality, such as low
socioeconomic status and food insecurity. However, the differences between urban and
rural residents regarding the association of fruit and vegetable consumption with
cognitive performance have not been explored. The aim of this study was to investigate
the association of fruit and vegetable consumption with cognitive performance in urban
and rural areas in a nationally representative sample of Brazilian older adults.
METHODS: The sample included 9,412 adults aged 50 years or older from the Brazilian Longitudinal
Study of Aging (Estudo Longitudinal da Saúde dos Idosos Brasileiros [ELSI]). The association
between consumption of fruits and vegetables and cognitive performance was evaluated
using linear regression.
RESULTS: In 8,158 participants (mean age 61.6 ± 9.3 years, 54% women, 44% White, and 15% from
rural areas), the mean frequency of fruit and vegetable consumption was 2.0 ± 1.3
times a day. Higher intake of fruits and vegetables was associated with better memory
(ß = 0.031, 95%CI 0.014-0.049), verbal fluency (ß = 0.030, 95%CI 0.004-0.056), and
global cognition (ß = 0.035, 95%CI 0.015-0.055) performance in urban, but not rural
residents (p for interaction = 0.036).
CONCLUSION: Higher frequency of fruit and vegetable intake was associated with better cognitive
performance in urban, but not in rural areas in Brazil.
Keywords: Cognition; Rural population; Urban population; Diet; Aging.
FIGURES
| Received: July 25 2023; Accepted: October 23 2023 |
INTRODUCTION
Dementia is currently the seventh leading cause of death and one of the main causes of disability in the world.1 It is estimated that 55.2 million people aged 60 years or older worldwide were living with dementia in 2019.2 Since there are no effective treatments for dementia, identifying preventive measures is of high importance.3 Adherence to a healthy diet, including high consumption of fruits and vegetables, has been associated with lower risk of cognitive decline and dementia.4,5
Rural residence has been frequently associated with lower diet quality compared to urban residence.6,7 While consumption of fruits, vegetables, and fish has been reported as lower in rural areas compared with urban areas, consumption of fat-rich red meat is reportedly higher in rural areas.8,9 Additionally, people living in rural areas have been shown to have a less diverse diet and to be more likely to suffer from food insecurity than their urban counterparts.10,11 Rurality has been associated with several risk factors for poor diet quality, such as low education, low income, and older age, as well as high costs of and lower accessibility to healthy foods.9,11,12
Disparities between older adults living in rural and urban areas are an important health concern, particularly because rural residence has been associated with increased dementia risk.13-15 However, differences in the association between fruit and vegetable consumption and cognitive performance in people living in urban or rural areas have not been explored. The aim of this study was to investigate whether fruit and vegetable consumption was associated with cognitive performance in a nationally representative sample of middle-aged and older adults living in urban and rural areas in Brazil.
METHODS
Study sample
We used data from the Brazilian Longitudinal Study of Aging (Estudo Longitudinal da Saúde dos Idosos Brasileiros [ELSI]), an ongoing nationally representative longitudinal survey of Brazilian adults aged 50 years or older. The baseline survey was conducted in 2015.16 During a home-based interview with trained interviewers, participants answered questions about sociodemographic factors, lifestyle habits, mental and physical health, and cognitive function.16 For this study, we excluded proxy interviews (n=328), participants with a self-reported history of stroke (n=457), Alzheimer's disease (n=47), or Parkinson's (n=43) disease, and participants with missing data in the dietary assessment (n=137) or cognitive test battery (n=242) (Figure S1, available as online-only supplementary material).
Dietary assessment
Fruit and vegetable consumption was evaluated with a qualitative food frequency questionnaire that assessed the participants' weekly and daily frequency of consumption of several food groups. For this study, we calculated the daily frequency of fruit and vegetable consumption. For that, the reported number of daily servings of fruit was multiplied by the reported number of days with fruit consumption during the week and divided by seven. The same procedure was used for vegetables. We also calculated the combined consumption of fruits and vegetables - for that, the number obtained by multiplying the reported number of daily servings by the reported number of days with fruit and vegetable consumption during the week was summed and then divided by seven.
Cognitive function
Assessment of cognitive performance in the ELSI was designed to be comparable to that of other Health and Retirement Study (HRS) sister projects. Evaluation of cognitive function covered a 10-word immediate recall and late recall tests as well as semantic verbal fluency, prospective memory, semantic memory, and temporal orientation. For the immediate recall test, the participant listened to a recording of 10 unrelated words and was asked to recall as many words as possible immediately after the recording. The score for this test was the sum of the correct words recalled and ranged from 0 to 10. After approximately 5 minutes, during which the participant performed other cognitive tests, they were again asked to recall the maximum number of words from the list, without new presentation. The delayed recall score was the sum of the correct words recalled and ranged from 0 to 10. Temporal orientation was evaluated by asking the participant to inform the current day, month, year, and day of the week. The score for this test was the sum of the correct pieces of information (0-4). In the semantic verbal fluency test, the participant was asked to list as many animals as possible during a maximum time of 1 minute. The score for this test was the sum of correct, non-repeated animals. For the prospective memory test, before any of the tests, the participant was informed that they would at some point be given paper and pencil to write their initials on the upper left corner of the paper. After the verbal fluency test, the participant was given paper and pencil without further instructions. The score of this test was calculated as follows: participants received two points if they remembered to write their initials in the right place once given the paper, one point if they wrote their initials on the paper in the wrong place or if they wrote their initials in the right place after being encouraged by the interviewer, and 0 points if they did anything else. The semantic memory was evaluated by asking the participant two questions about everyday items and two questions about current politics. The score for this test was the sum of all correct answers (0-4).
We calculated z scores for each of the tests by subtracting the mean sample test score from the participant's score and dividing this difference by the SD of the test. We calculated a composite memory score by calculating the average z score from the immediate and late recall, the prospective memory, and the semantic memory tests, followed by standardization of this mean. We also calculated a global cognition score by averaging the z scores from all the tests and standardizing this average.
For the sensitivity analysis, we characterized participants who answered the direct interview as cognitively impaired if global cognition z scores were lower than -1.5 SD.17 For this analysis, we also included proxy interviewees. For the proxy interview, cognitive function was assessed using the shortened version of the 16-item Informant Questionnaire on Cognitive Decline in the Elderly (IQCODE).18 For each question, informants scored the current cognitive abilities of the participant about whom they were answering from 1 (much improved) to 5 (much worse) compared to 2 years ago. The score for all questions was then summed and divided by 16, resulting in a final score of 1 to 5. We then characterized participants as cognitively impaired if the IQCODE score was equal to or higher than 3.4 or not impaired if the score was lower than 3.4.18
Definition of urban and rural areas
Rural and urban areas of residence were defined according to the Brazilian Institute of Geography and Statistics (Instituto Brasileiro de Geografia e Estatística, IBGE). The IBGE receives information about urban and rural areas from each state during the census period. In Brazil, urban areas are delimited by municipal law, and rural areas are defined as areas that are not classified as urban.19 The definition of urban areas in Brazil differs by state. For example, in the state of Tocantins, a city must have a population of at least 1,200, at least 350 voters, and 300 houses. In the state of São Paulo, there is no minimum number of residents, but a city must have at least 200 houses and 1,000 voters.20
Covariates
Covariates included the following continuous variables: age in years, years of education, monthly per capita income, and measured body mass index (BMI). Categorical variables included sex, self-reported race/ethnicity (Black, Mixed, White, and other races), rural/urban area of residence, self-reported previous diagnosis of hypertension (yes or no), cardiovascular disease (yes or no), diabetes (yes or no), depressive symptoms (yes or no), physical activity (yes or no), access to private healthcare (yes or no), smoking (never, former, current), and current alcohol consumption (yes or no). Missing covariates (Table S1, available as online-only supplementary material) were imputed using multiple imputations by chained equations.21
BMI was calculated as weight in kilograms divided by height in meters squared. Depressive symptoms were calculated using the Center for Epidemiological Scale-Depression (CES-D) with a cutoff of four points.22 Physical activity was calculated using the short version of the Physical Activity Questionnaire (IPAQ). Total physical activity was calculated as a sum of minutes from moderate physical activity and minutes from vigorous physical activity multiplied by 2.23 Participants were then categorized as performing enough physical activity if they reached the recommended minimum of 150 minutes a week of moderate or intense physical activity and not enough if they did not meet the minimum recommended amount.24
Statistical analyses
All analyses accounted for the sampling design of the ELSI and were adjusted using the survey weights, stratum, and cluster. Descriptive analyses were presented as mean and SD for continuous variables and as percentages for categorical variables. The difference in covariates according to rural/urban residence was described using t test for continuous variables and chi-square for categorical variables.
We used linear regression models to evaluate the association of between the frequency of fruit and vegetable consumption and cognitive performance combined (fruits + vegetables) and individually (only fruits/only vegetables). Model 1 was adjusted for age, sex, race/ethnicity, education, income, and urban/rural area. Model 2 was additionally adjusted for BMI, hypertension, cardiovascular disease, diabetes, depressive symptoms, physical activity, smoking, current alcohol consumption, and access to private healthcare. To investigate if urban/rural area of residence was a modifier in the association of fruit and vegetable consumption with cognitive performance, we added an interaction term between area of residence and fruit and vegetable consumption in Model 2.
We also performed two sensitivity analyses. First, we repeated the regressions using complete case analysis, excluding participants who had missing data for covariates (n = 1,415). We also assembled logistic regression models using cognitive impairment as the outcome. The alpha level was set at 5% for the association analyses and at 10% for the interaction analyses. All statistical analyses were performed using R version 4.1.2 and the survey package.25
RESULTS
Sample characteristics
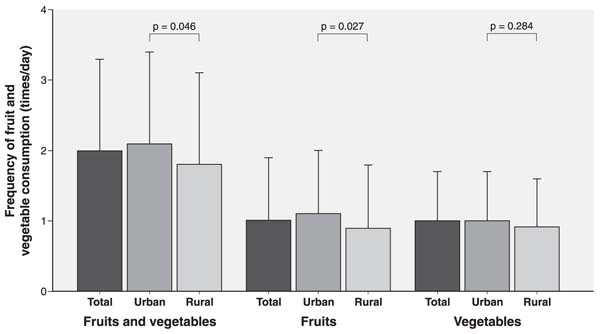
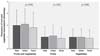
Among 8,158 participants, 15% lived in rural areas. Mean age was 61.6 ± 9.3 years, 53.8% were women, and 44.1% were White. Frequency of fruit and vegetable consumption was 2.0 ± 1.3 times a day in urban areas and 1.8 ± 1.3 time a day in rural areas (Figure 1). Rural residents were more likely to have fewer years of education, lower income, less access to private healthcare, and lower consumption of fruits and vegetables compared with urban residents (Table 1 and Figure 1). Table S1 shows the comparison between participants who were included and excluded from this analysis. Excluded participants were more likely to be older, have fewer years of education, lower income, and higher incidence of hypertension, diabetes, and cardiovascular disease (Table S2). There were no differences in the percentage of rural residents, nor in the frequency of fruit and vegetable consumption between participants who were included and excluded from the study (Table S2).
| Total (n =8,158) | Urban (n= 6,912) | Rural (n=1,246) | p-value | |
|---|---|---|---|---|
| Age in years, mean (SD) | 61.6 (9.3) | 61.6 (9.3) | 61.9 (8.9) | 0.638 |
| Female | 53.8 | 53.7 | 54.4 | 0.753 |
| Race | 0.557 | |||
| Black | 9.4 | 8.9 | 11.7 | |
| Mixed┼ | 43.6 | 42.9 | 47.7 | |
| White | 44.1 | 45.3 | 37.1 | |
| Other╬ | 2.9 | 2.9 | 4.1 | |
| Years of education, median (IQR) | 5 (3-11) | 5 (4-11) | 3 (1-4) | < 0.001 |
| Income, median§ (IQR) | 247.8 (147.9-405.4) | 264.2 (156.9-432.4) | 183.2 (118.3-264.2) | < 0.001 |
| Body mass index, mean (SD) | 27.9 (5.3) | 28.1 (5.3) | 27.0 (5.1) | < 0.001 |
| Hypertension | 50.1 | 49.6 | 53.2 | 0.111 |
| Diabetes | 15.1 | 15.9 | 10.3 | < 0.001 |
| Cardiovascular disease | 4.5 | 4.7 | 3.5 | 0.100 |
| Alcohol consumption | 20.4 | 21.4 | 14.1 | 0.012 |
| Smoking | 0.382 | |||
| Never | 46.5 | 47.1 | 43.4 | |
| Former | 36.5 | 36.1 | 39.4 | |
| Current | 17.0 | 16.8 | 17.2 | |
| Physical activity|| | 15.1 | 14.4 | 19.7 | 0.055 |
| Depressive symptoms¶ | 31.8 | 32.4 | 27.9 | 0.095 |
| Private healthcare access | 26.2 | 28.9 | 10.6 | < 0.001 |
Data presented as percentage, unless otherwise specified.
IQR = interquartile range.
┼ Includes mixed Black and White.
╬ Includes Asian, Indigenous, or other races/ethnicities.
§ Monthly per capita income in US dollars.
|| 150 minutes a week of moderate or intense physical activity.
¶ Score of 4 or higher in the Center for Epidemiological Scale-Depression (CES-D).
Association of fruit and vegetable consumption with cognitive performance
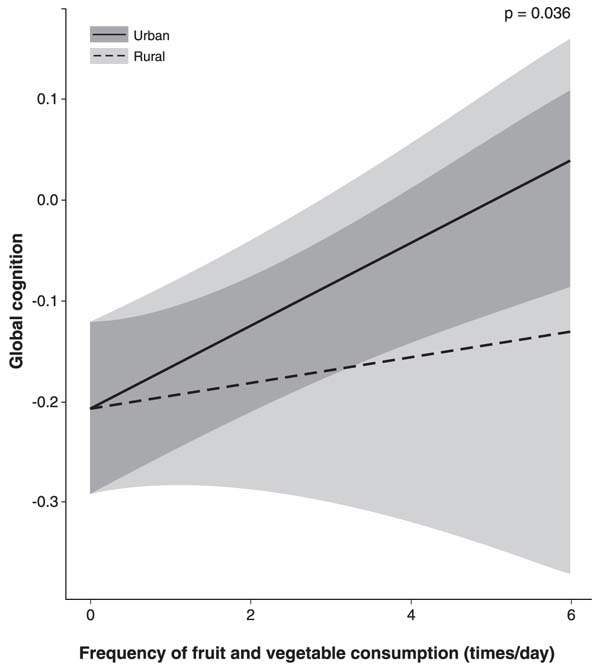
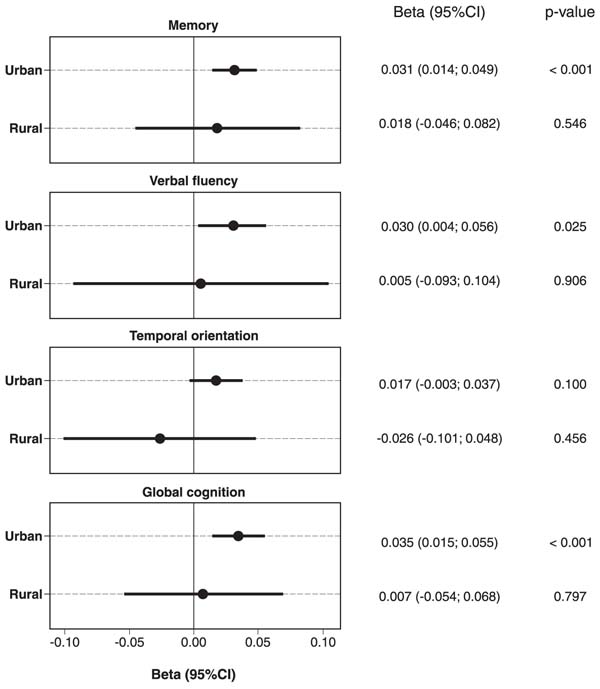
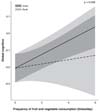
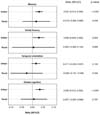
Higher frequency of combined fruit and vegetable consumption was associated with better performance in memory (ß = 0.031, 95%CI 0.015-0.048, p = 0.005), verbal fluency (ß = 0.026, 95%CI 0.001-0.051, p = 0.038), and global cognition (ß = 0.033, 95%CI 0.015-0.050, p < 0.001) tests (Table 2). Rural/urban area of residence was a modifier in the association between fruit plus vegetable consumption and cognitive performance (p for interaction = 0.036) (Figure 2). Stratified analysis showed that higher frequency of combined fruit and vegetable consumption was associated with better performance in memory (ß = 0.031, 95%CI 0.014-0.049, p < 0.001), verbal fluency (ß = 0.030, 95%CI 0.004-0.056, p = 0.025), and global cognition (ß = 0.035, 95%CI 0.015-0.055, p < 0.001) tests in urban but not rural residents (Figure 3).
| Unadjusted | Model 1 | Model 2 | ||||
|---|---|---|---|---|---|---|
| ß (95%CI) | p-value | ß (95%CI) | p-value | ß (95%CI) | p-value | |
| Memory | 0.089 (0.070-0.107) | < 0.001 | 0.022 (0.028-0.060) | < 0.001 | 0.031 (0.015-0.048) | 0.005 |
| Verbal fluency | 0.080 (0.056-0.106) | < 0.001 | 0.037 (0.012-0.059) | 0.003 | 0.026 (0.001-0.051) | 0.038 |
| Temporal orientation | 0.052 (0.031-0.073) | < 0.001 | 0.022 (0.001-0.044) | 0.036 | 0.011 (-0.009-0.032) | 0.285 |
| Global cognition | 0.099 (0.078-0.121) | < 0.001 | 0.047 (0.030-0.065) | < 0.001 | 0.033 (0.015-0.050) | < 0.001 |
Model 1 = linear regression model adjusted for age, sex, education, race, income, and rural/urban area; Model 2 = linear regression model adjusted for age, sex, education, race, income, rural/urban area, alcohol consumption, smoking, hypertension, diabetes, cardiovascular disease, body mass index, depressive symptoms, private healthcare access, and physical activity.

We also investigated the association of fruits and vegetables individually with cognitive performance. Higher frequency of fruit consumption was associated with better memory (ß = 0.037, 95%CI 0.012-0.061, p = 0.003), verbal fluency (ß = 0.033, 95%CI 0.001-0.065, p = 0.041), temporal orientation (ß = 0.030, 95%CI 0.003-0.057, p = 0.026), and global cognition (ß = 0.044, 95%CI 0.019-0.069, p < 0.001) performance (Table S3). There was an interaction between the frequency of fruit consumption and area of residence (p for interaction = 0.023). Stratified analyses showed an association between higher frequency of fruit consumption and memory (ß = 0.041, 95%CI 0.015-0.066, p = 0.001), verbal fluency (ß = 0.039, 95%CI 0.008-0.071, p = 0.013), temporal orientation (ß = 0.037, 95%CI 0.012-0.062, p = 0.003), and global cognition (ß = 0.050, 95%CI 0.024-0.076, p < 0.001) performance for urban residents but not for rural residents (Table S4).
Higher frequency of vegetable consumption was associated with better memory (ß = 0.041, 95%CI 0.013-0.069, p = 0.004) and global cognition (ß = 0.034, 95%CI 0.005-0.062, p = 0.020) performance (Table S3). There was an interaction between the frequency of vegetable consumption and area of residence (p for interaction = 0.095). Stratified analyses showed an association between higher frequency of vegetable consumption and memory (ß = 0.034, 95%CI 0.001-0.068, p = 0.043) for urban but not rural residents (Table S5).
Sensitivity analysis using complete case analysis did not substantially change the results (Table S6 to Table S10). We additionally investigated if fruit and vegetable consumption was associated with cognitive impairment. Higher fruit consumption was associated with lower odds of cognitive impairment in the total sample (odds ratio [OR] = 0.861, 95%CI 0.746-0.994, p = 0.041) (Table S11). Fruit consumption was also associated with lower odds of cognitive impairment in urban (OR = 0.819, 95%CI 0.697-0.963, p = 0.016) but not rural residents (Table S12).
DISCUSSION
In a nationally representative sample including 8,158 older Brazilian adults, we observed that a higher frequency of combined fruit and vegetable consumption was associated with better cognitive performance. Higher frequency of vegetable consumption was associated with better memory and global cognition performances. Fruit consumption, as well as fruit and vegetable consumption combined, were associated with better cognitive performance in urban, but not rural residents. Conversely, vegetable consumption was associated with better memory performance in urban residents only.
In Brazil, only 24% of the population meets the recommended 400 g daily intake of fruits and vegetables.26 Consumption of these food groups was also low in the present study, with fruit and vegetable consumption even lower in rural than in urban areas. This might be related to food insecurity in rural areas. In the United States, 90% of food-insecure households were in rural areas in 2020.27 In Brazil, food insecurity affects 60% of rural households, with an increase noted from 2020 to 2021.28 Evidence shows that rural residents have less access to affordable healthy food and food diversity than urban area residents.10,11 Furthermore, rural consumers were less likely to be satisfied with their diets than urban consumers.29
Our findings associating higher fruit and vegetable consumption with better cognitive performance are in line with those of several previous studies showing that consumption of these food groups was associated with a lower risk of cognitive impairment and dementia.4,30 Moreover, fruits are one of the Mediterranean diet food groups associated with lower risk of dementia.31 Higher fruit consumption was also associated with lower risk of cognitive impairment in the World Health Organization Study on Global Ageing and Adult Health (SAGE) cohort.30 Contrary to our findings, some studies only found an association between the consumption of vegetables, particularly green leafy vegetables and cruciferous vegetables, but not fruit, and slower cognitive decline.5,32 This might be due to differences in access to variety, as a higher variety of fruits and vegetables has been associated with lower risk of cognitive impairment, independently of quantity.33 Moreover, there may be differences in the definition of vegetables, as the ELSI does not differentiate between root and other types of vegetables. There may also be differences in the types of vegetables and fruits consumed in different cohorts depending on local dietary habits and food availability.
Higher frequency of fruit and vegetable consumption was not associated with cognitive performance in rural residents. In our study, rural residents differed from their urban counterparts in many ways. They had fewer years of education, lower income, lower private healthcare access, and lower fruit and vegetable consumption. Less education is a risk factor for dementia, and it is estimated that 7.7% of dementia cases in Brazil are attributable to it.34 Rural workers often have lower wages and fewer job opportunities compared with urban workers.35 They also engage in less complex and cognitively stimulating jobs compared with urban workers.35 In addition, high food costs negatively impact access to healthy foods for lower-income families.9 Consequently, low income has been associated with food insecurity and also with poorer dietary choices, as low socioeconomic status shoppers purchased fewer fruits and vegetables and more ultra-processed foods.36 In fact, evidence from Brazil has shown that income was a modifier in the association between the Mediterranean-DASH diet intervention for neurodegenerative delay (MIND diet) and cognitive performance.37 In that sample, higher adherence to the MIND diet was associated with worse global cognitive performance in low-income participants, possibly due to the lower nutritional quality of the food items purchased by lower-income participants.37 Finally, rural populations have less access to healthcare services compared with urban populations, which may lead to less disease diagnoses and lack of treatment for those in need.38 Indeed, there is evidence that older adults in rural communities are underdiagnosed or diagnosed at later stages of dementia.39 They also receive less specialized treatment, which may negatively affect disease outcomes.40 While we did adjust for education, income, and private healthcare coverage, we cannot rule out the possibility of unmeasured confounding factors, such as quality of education, lost job opportunities, and ease of access to the public healthcare system.
This study has some limitations. First, the study's cross-sectional design prevents us from determining causal relationships. In addition, we used many self-reported measures, such as previous diagnoses of hypertension, diabetes, cardiovascular disease, and stroke. Therefore, we were unable to adjust the analysis for undiagnosed diseases. We also cannot rule out the possibility of reverse causation, as participants with worse cognitive abilities may make poor dietary choices. Furthermore, physical activity and dietary consumption, which are sensitive to social desirability bias, were also self-reported. Additionally, the ELSI-Brasil food frequency questionnaire is qualitative and does not allow comparison of portion sizes or quantification of fruit and vegetable variety. Although we adjusted for several variables, we cannot rule out the possibility of unmeasured confounders. Moreover, our findings may be subjected to selection bias since the characteristics of included and excluded participants differed. Despite these limitations, this study has several strengths. First, it adds important evidence of urban and rural disparities in cognitive performance. Second, we used a nationally representative sample of Brazilian older adults. We also performed sensitivity analyses that strengthened our findings. Finally, cognitive assessment in the ELSI was designed to be comparable to other HRS sister studies, which could facilitate the comparison of our results with findings from other studies.
In conclusion, the area of residence seems to play a critical role in the association of fruit and vegetable consumption with cognitive performance. In Brazil, urban residents with higher intakes of fruits and vegetables had better cognitive performance than those with lower intakes. This association was not observed among rural residents. Future research in other countries is needed to confirm our findings, and longitudinal studies investigating possible explanations for rural and urban disparities in cognitive decline are warranted.
ACKNOWLEDGEMENTS
This study was not preregistered. Data from Estudo Longitudinal da Saúde dos Idosos Brasileiros [ELSI]) is publicly available at https://elsi.cpqrr.fiocruz.br/. The ELSI-Brazil was supported by the Brazilian Ministry of Health: Departamento de Ciência e Tecnologia from Secretaria de Ciência, Tecnologia e Insumos Estratégicos (DECIT/SCTIE, grants: 404965/2012-1 and TED 28/2017); Coordenação de Saúde da Pessoa Idosa na Atenção Primária, Departamento dos Ciclos da Vida from Secretaria de Atenção Primária à Saúde (COPID/DECIV/SAPS, grants: 20836, 22566, 23700, 25560, 25552, and 27510).
DISCLOSURE
The authors report no conflicts of interest.
 PDF
 Print
 Send this article by email
 How to cite this article
 Submit a comment
 Mendeley
 Pocket
 Share on Facebook
 Share on Twitter