



ABSTRACT:
OBJECTIVE: The aim of the present study was to analyze the body sway response in specific phobia
(SP) patients and healthy controls while viewing neutral, phobic, and disgusting images.
METHODS: The participants' heart rate (HR) and skin conductance were also recorded during the
procedure. Nineteen patients with arachnophobia and 19 healthy volunteers matched
by age, gender, and years of education underwent a postural control test on a stabilometric
platform.
RESULTS: The platform recorded increased body sway in the SP group when exposed to spider images
(SPI). The SP group presented increases in most parameters (SD, velocity, frequency,
area, p = 0.05) when viewing pictures of the SPI category. Psychometric measures of
subjective anxiety (State-Trait Anxiety Inventory, STAI) and physiological states
(HR; skin conductance responses; spontaneous fluctuations in skin conductance) showed
increased anxiety (p = 0.05) in the SP group compared to healthy volunteers. High
anxiety levels were observed throughout the assessment, including the task of exposure
to SPI (p = 0.05). No significant effect or correlation was found between skin conductance
and body sway measures (p > 0.05).
CONCLUSIONS: The results of the postural control test suggest the occurrence of a defensive escape
response in SP, in agreement with previous evidence.
Keywords: Specific phobia; sway; stabilometric platform; exposure to spiders.
FIGURES
| Received: August 28 2020; Accepted: October 12 2020 |
INTRODUCTION
Specific phobia (SP) is one of the most common anxiety disorders, characterized by unreasonable, excessive, and persistent fear in the presence or anticipation of feared situations or objects.1 Among SP subtypes, arachnophobia has been widely investigated because it is a useful model for the study of other phobia subtypes, as well as for trials on the effectiveness of psychotherapy techniques.2
The study of emotions such as fear and anxiety involves the comprehension of defense reactions to stimuli that pose threats to the survival of the species. That is, the structures underlying defense reactions in fear and anxiety are organized into a functional hierarchy (from the cortex to the brainstem) and respond according to the distance to the threat source, in such a way that all the structures involved take part in the modulation of each behavior.3 Animal studies have shown that, in the presence of a potential threat, animals present risk assessment behaviors, with body movements and postures that allow them to approach and investigate the possible threat. Such behaviors are regarded by investigators as displays of anxiety. When faced with actual threatening stimuli, animals present flight or immobility behaviors towards distal stimuli and fight or flight behaviors when stimuli are close,4,5 which are characteristics of fear.
Several measures are recorded during anxiety-inducing protocols. Psychophysiological measures commonly used in the study of SP include self-rating scales, arterial blood pressure and heart rate (HR), and electrodermal parameters.6,7 The latter seem to be mediated exclusively by sympathetic processes related to the medial prefrontal cortex, which is linked to warnings regarding future punishment.8
Another anxiety measure that can be recorded during experimental paradigms is body sway. The postural control test evaluates body stability in humans by quantifying anteroposterior (AP) and mediolateral (ML) body stability in the orthostatic position, providing a unified measure of body posture during the presentation of visual stimuli. Poor postural balance may result from impaired functioning of the central nervous system, as well as from exposure to stimuli interpreted as posing danger or a threat to survival. Although preliminary in nature, studies using this test have been conducted in human subjects with psychiatric disorders,9 including posttraumatic stress disorder,10 panic disorder,11 and social anxiety disorder.12 In respect to SP, the only study using balance measures to date described increased anxiety and dizziness, together with increased body oscillation, during exposure to visual phobic stimuli in SP subjects compared to healthy controls.13
With the purpose of better understanding defense responses in SP and considering the paucity of investigations on body sway in SP, the aim of our study was to analyze body sway parameters in patients with an SP (namely, arachnophobia) and healthy volunteers while they viewed different kinds of pictures with neutral, phobic, or disgusting content. Supplemental neurovegetative response measures, including HR and skin conductance, were also recorded.
METHODS
Participants were recruited through announcements of the study in posters, via e-mail, on social networks, and on local television. A total of 52 people responded to the ad, of whom 38 (73.1%) fulfilled the inclusion criteria (mean age: 30.94 ± 8.06) and were divided into a control group (CG; n=19) and a SP group (n=19). The two groups were matched by age, gender, and years of education (Table 1).
| Characteristics | SP | CG | Statistics | p-value |
|---|---|---|---|---|
| Gender, n | ||||
| Male | 2 | 2 | ?2 = 0.00 | 1.00 |
| Female | 17 | 17 | ||
| Handedness, n | ||||
| Right | 18 | 17 | ?2 = 0.36 | 0.54 |
| Left | 1 | 2 | ||
| Age (years) | 30.78±1.92 | 30.94±1.85 | t36 = -0.59 | 0.95 |
| Education (years) | 14.43±0.61 | 15.47±0.46 | t36 = 1.20 | 0.20 |
| Socioeconomic level, % | ||||
| A1/A2 | 31.57 | 31.57 | ||
| B1/B2 | 47.36 | 52.63 | ||
| C1/C2 | 21.05 | 15.78 | ||
| D | 0.00 | 0.00 | ||
| E | 0.00 | 0.00 | ||
| BAI | 11.10±1.46 | 5.68±1.67 | t36 = -2.46 | 0.32 |
| SPQ | 113.73±2.34* | 21.84±1.44 | t36 = 33.20 | 0.001 |
| STAI-trait | 14.6±0.60* | 11.4±0.50 | t36 = 3.20 | 0.02 |
Data presented as mean ± standard error, unless otherwise specified.
BAI = Beck Anxiety Inventory; CG = control group; SP = specific phobia; SPQ = Spider Phobia Questionnaire; STAI = State-Trait Anxiety Inventory.
Independent t tests were used to assess between n-group differences in quantitative variables.
* Significant at p < 0.05.

The inclusion criteria for the two groups were: 1) age between 18 and 40 years; 2) at least 8 years of education; and 3) provision of informed consent before starting the study. The exclusion criteria for the two groups were: 1) presence of organic brain syndromes; 2) abuse of psychoactive drugs (except nicotine); 3) presence of general medical conditions diagnosed during the admission interview or physical examination; 4) presence of other psychiatric conditions besides SP (for the SP group), except for previous depressive episode in remission (occurring at least 6 months prior to inclusion in the study); 5) current or previous use of psychotropic medications; and 6) presence of pacemakers, aneurysm clips, or ferromagnetic foreign bodies. None of the participants with SP had received previous pharmacological or psychological treatment.
The diagnosis and subtypes of psychiatric disorders were confirmed with the clinical version of the Structured Clinical Interview for DSM-IV (SCID-CV) translated and adapted to Portuguese.14 SP diagnosis was further confirmed with the Spider Phobia Questionnaire (SPQ) (Watts & Sharrock,15 translated by Granado et al.16).
Sensorial, motor and neurovegetative recordings
Anxiety
The State-Trait Anxiety Inventory (STAI) (Spielberger et al.,17 translated and adapted to Portuguese by Biaggio18) was used in the present study in its six-item short version adapted by Fioravanti-Bastos et al.19 The STAI measures two components of anxiety: state (STAI-S) and trait (STAI-T).
Neurovegetative responses
HR was estimated with a vital signs monitor (DX 2022, Dixtal, Brazil). Skin conductance was measured with a psychophysiological computerized system (Contact Precision Instruments, UK) connected to a constant voltage source (0.6 V) for recording of SCR and number of spontaneous fluctuations (SF) in skin conductance.
Motor response (body sway)
Changes in body sway were recorded with a force plate (AccuSway Platform Plus, Advanced Mechanical Technology, Inc., USA). Stabilometric signals were sampled at 50 Hz using an antialiasing filter with a frequency of 5 Hz. Based on insulation of the center of pressure in the mediolateral (ML) and anteroposterior (AP) directions, the following parameters were calculated for each subject: 1) standard deviation (SD); 2) mean velocity (vel); 3) medium frequency (freq); and 4) elliptical balance area (mm).
Visual stimuli
While standing on the force plate, subjects were exposed to 28 images distributed into four categories: spider images (SPI), disgusting images (DI), neutral images (NE), and spider-like images (SL). The NE set consisted of photographs of emotionally neutral faces were taken from the International Affective Picture System (IAPS),20 as well as neutral pictures such as geometric figures. The SL set was taken from a series used in spiderless arachnophobia therapy (SLAT),21 which includes stimuli with a physical resemblance to spiders. Each category contained seven photos, and each image was presented for 3 seconds. During the presentation, categories were separated by a gray image presented for 21 seconds. Before starting the balance measures, participants were instructed to stand upright without moving and to look at the images that would be projected.
Procedures
Measures of anxiety (STAI), HR, and skin conductance were recorded in six different phases of the protocol: baseline (BL), when the participant arrived at the laboratory; pre-test (PT), 30 minutes later, anticipatory anxiety (A), after the investigator described the task to be performed; task (T), during task performance; post-stress 1 (F1), immediately after the task; and post-stress 2 (F2), 30 minutes after F1. Skin conductance and body sway measures were collected in phase T while the images were presented in the following sequence: NE1, DI, NE2, SPI, NE3, and SL.
Statistical analysis
Clinical scores and demographic were analyzed with Student's t test. STAI, HR, SCR, SF, and body sway were analyzed by two-way repeated measure analysis of variance (ANOVA) (or multivariate analysis of variance [MANOVA]) with three factors: groups (CG vs. SP), phase, and group vs. phase interactions. When appropriate, independent t tests were used in each phase to compare differences between SP and CG. Within-group analyses were done by one-way ANOVA followed by Bonferroni's test for multiple comparisons. When sphericity was not reached, the degrees of freedom of the repeated factor were corrected with Huynh-Feldt epsilon. The correlations among the measures of anxiety, HR, skin conductance, and body sway were analyzed, including both groups (SP and CG) and with the SP group alone, using the Spearman correlation coefficient (for non-normally distributed variables) or with the Pearson correlation coefficient (for normally distributed variables). To achieve normal data distribution, skin conductance values were transformed into logarithms (Statistical Package for the Social Sciences version 10.0). The significance level was set at p < 0.05.
Ethics statement
All subjects gave written consent to participate after being fully informed about the research procedures, which had been approved by the local ethics committee (opinion 14554/2009).
RESULTS
There were no significant differences between groups in terms of age, education, and gender distribution (p > 0.05 - Table 1).
Body sway
Table 2 shows the results of the force plate test (mean ± SD) for the SP and CG groups when viewing the different image categories. The SP group presented increases in most parameters (SD, velocity, frequency, area) when viewing pictures of the SPI category. With respect to area, rmANOVA revealed effects of phase (F1,55 = 6.4; p < 0.001) and group vs. phase interaction (F1,55 = 5.6; p < 0.01), and a t test confirmed a difference between CG and SP in the SPI category (p < 0.01). No within-group differences were found. Concerning the SD in ML measures, we detected effects of phase and group vs. phase interaction (F3,108 = 3.2; p < 0.01). These effects were not confirmed by a t test. With respect to the AP SD, we detected effects of phase (F3,123 = 9.9; p < 0.001), group (F1,35 = 5; p < 0.03), and group vs. phase interaction (F3,123 = 7.3; p < 0.01). A t test confirmed the existence of differences between CG and SP subjects in the SPI category (p < 0.01). In SP subjects, within-group differences were found between the SPI and previous NE categories (p < 0.01). We found no significant changes in measures of AP frequency. Concerning ML frequency, we found effects of phase (F4,173 = 3.8; p < 0.001), group (F1,35 = 6; p = 0.015), and group vs. phase interaction (F4,173 = 4.0; p < 0.01), and a t test confirmed the existence of differences between CG and SP subjects in the BL NE1 and SPI categories (p < 0.01). Within-group differences in the SP group showed that the ML frequency was higher in the SPI category compared to phases DI and final NE3 (p < 0.01). With respect to mean velocity in the ML direction, we found effects of phase (F2,84 = 8.9; p < 0.001), group (F1,35 = 4; p = 0.05), and group vs. phase interaction (F2,84 = 9.0; p < 0.01), and a t test confirmed differences between CG and SP subjects in categories SPI (p < 0.01) and subsequent NE2 (p < 0.01). We found within-group differences in the SP group, with increased mean velocity in the SPI category compared to BL NE1, DI, subsequent NE2, and final NE3. Finally, measures of mean AP velocity showed effects of phase (F1,62 = 16.9; p < 0.001), group (F1,35 = 11; p < 0.001), and group vs. phase interaction (F1,62 = 16.0; p < 0.01), and a t test confirmed differences between CG and SP subjects in category SPI (p < 0.01) and subsequent NE2 (p < 0.01). Within-group differences in SP subjects showed increased velocity in the SPI category relative to all remaining categories (p < 0.01).
| Posturographic parameter | SP | CG |
|---|---|---|
| Neutral (NE1) | ||
| Area (mm2) | 201.55±31.90 | 209.2±22.50 |
| ML SD (mm) | 3.75±0.27 | 4.4±0.20 |
| AP SD (mm) | 4.23±0.47 | 3.90±0.30 |
| ML freq (Hz) | 0.37±0.03 | 0.20±0.01 |
| AP freq (Hz) | 0.24±0.01 | 0.20±0.01 |
| ML (vel) | 10.65±0.83 | 9.40±0.50 |
| AP (vel) | 9.02±0.44 | 8.00±0.40 |
| Disgusting (DI) | ||
| Area (mm2) | 192.86±29.09 | 161.50±18.30 |
| ML SD (mm) | 4.09±0.34 | 3.90±0.20 |
| AP SD (mm) | 3.76±0.27 | 3.40±0.20 |
| ML freq (Hz) | 0.31±0.03 | 0.20±0.02 |
| AP freq (Hz) | 0.24±0.01 | 0.20±0.01 |
| ML (vel) | 10.24±0.85 | 9.00±0.50 |
| AP (vel) | 8.35±0.38 | 7.60±0.20 |
| Neutral (NE2) | ||
| Area (mm2) | 189.73±24.87 | 158.60±20.10 |
| ML SD (mm) | 4.25±0.29 | 4.00±0.30 |
| AP SD (mm) | 3.63±0.29 | 3.20±0.20 |
| ML freq (Hz) | 0.27±0.01 | 0.20±0.01 |
| AP freq (Hz) | 0.22±0.01 | 0.20±0.01 |
| ML (vel) | 9.70±0.50 | 8.90±0.40 |
| AP (vel) | 7.90±0.35 | 7.40±0.20 |
| Spider (SPI) | ||
| Area (mm2) | 374.65±61.97* | 167.90±21.10 |
| ML SD (mm) | 4.70±0.40 | 4.10±0.30 |
| AP SD (mm) | 6.10±0.57*┼ | 3.40±0.10 |
| ML freq (Hz) | 0.41±0.02*┼ | 0.20±0.020 |
| AP freq (Hz) | 0.21±0.01 | 0.20±0.010 |
| ML (vel) | 14.30±1.30*┼ | 8.90±0.50 |
| AP (vel) | 14.20±1.21*┼ | 7.80±0.30 |
| Neutral (NE3) | ||
| Area (mm2) | 231.31±31.70 | 149.90±20.30 |
| ML SD (mm) | 4.40±0.30 | 3.70±0.20 |
| AP SD (mm) | 4.30±0.35 | 3.20±0.33 |
| ML freq (Hz) | 0.31±0.02 | 0.20±0.02 |
| AP freq (Hz) | 0.24±0.01 | 0.20±0.02 |
| ML (vel) | 10.54±0.60 | 8.50±0.36 |
| AP (vel) | 9.80±0.55 | 7.80±0.32 |
| Spider-like (SL) | ||
| Area (mm2) | 246.40±45.10 | 198.50±34.04 |
| ML SD (mm) | 4.30±0.40 | 4.50±0.40 |
| AP SD (mm) | 34.50±0.30 | 3.50±0.30 |
| ML freq (Hz) | 0.30±0.02 | 0.20±0.02 |
| AP freq (Hz) | 0.20±0.02 | 0.20±0.02 |
| ML (vel) | 10.50±0.80 | 8.80±0.40 |
| AP (vel) | 9.60±0.50 | 8.10±0.20 |
Data presented as mean ± SD in millimeters (mm).
AP freq = frequency of sway in the anteroposterior direction; AP SD = standard deviation in the anteroposterior direction; AP vel = mean velocity in the anteroposterior direction; ML freq = frequency of sway in the mediolateral direction; CG = control group; ML SD = standard deviation in the mediolateral direction; ML vel = mean velocity in the mediolateral direction; SP = specific phobia.
* p = 0.05 compared to the CG (analysis of variance [ANOVA]); ┼ p = 0.05 compared to SP.
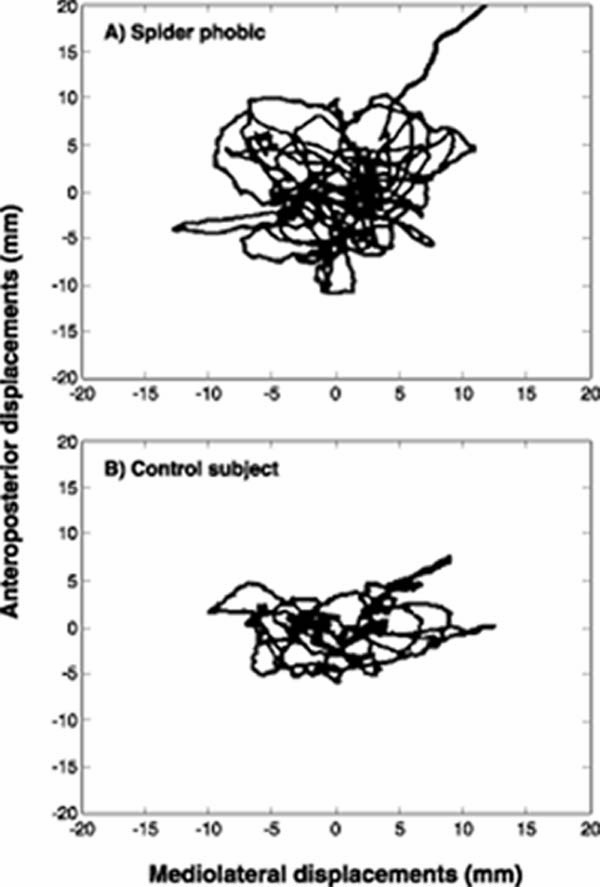
The graphic in Figure 1 shows body sway measures for a participant in the SP group (A) and a subject in the control group (B) in terms of AP and ML movements during exposure to a series of SPI. The larger elliptical balance area (mm) in the data from the SP participant as compared to the CG subject clearly illustrates the differences in body sway patterns between these individuals.
State-Trait Anxiety Inventory (STAI)
With respect to trait anxiety as measured with the STAI-T, we found statistically significant differences between groups. SP subjects had higher means than controls (t38 = -3.2, p = 0.02).
Comparisons between groups at each phase of the assessment showed that SP also had higher means than CG in the STAI-S in phases PT (p = 0.007), A (p < 0.001), F1 (p < 0.001), and F2 (p < 0.001). Within-group comparisons using the Bonferroni post-hoc test showed that the SP group had higher means in the STAI-S in phases A (p = 0.02) and F1 (p = 0.03) compared to phase PT. Also in the SP group, there was a significant increase in mean STAI-S scores in F1 compared to PT (p = 0.01) and F2 (p = 0.02).
Heart rate
Comparisons between groups in each phase showed that increased HR was associated with presentation of images in categories NE1 (p = 0.004), DI (p < 0.001), NE2 (p = 0.03), SPI (p < 0.001), NE3 (p < 0.001), and SL (p < 0.001) in SP compared to CG. Within-group comparison based on Bonferroni's post-hoc test showed that SP had higher HR means when viewing pictures in the SPI category compared to NE2 (p < 0.001). There were no statistically significant differences in HR measures acquired during presentation of the different stimuli categories in the CG.
Skin conductance
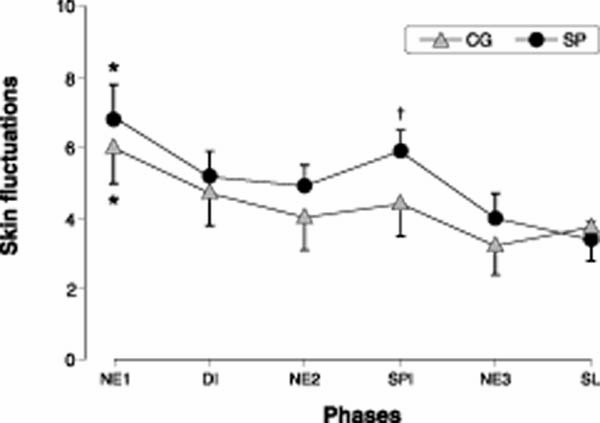
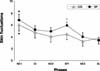
No statistically significant differences in SCR were found. Regarding SF, the SP group had increased fluctuations when exposed to SPI pictures compared to the subsequent category, NE (p < 0.001). SF measures were also higher during series NE1 compared to SL (p < 0.05). Among controls, SF means were higher during the presentation of NE1 pictures compared to categories NE2 (p < 0.005), SPI (p < 0.001), NE3 (p < 0.001), and SL (p = 0.01) (Figure 2).
No significant effect or correlation was found between skin conductance and body sway measures (p > 0.05).
DISCUSSION
We found that SP participants exhibited (i) increased sway area, (ii) increased standard deviation in the AP direction, (iii) increased oscillation frequency in the ML direction, (iv) increased average velocity in the ML direction, and (v) increased average velocity in the AP direction in the force plate test when viewing SPI pictures. Thus, it is possible to deduce abnormal body sway during the presentation of phobic stimuli in the SP group, especially from the increased AP displacement parameters.
These results are consonant with previous evidence of increased body instability in individuals with fear of heights exposed to visual heights stimuli13 and undergoing visual attention activity screening.22 Additionally, studies with healthy volunteers have shown that increased anxiety is associated with increased postural instability.23
There are, however, divergences in the field of body sway and anxiety. Decreased body sway has been described in patients with panic disorder exposed to anxiogenic pictures.11 Azevedo et al.24 detected postural freezing in healthy volunteers subjected to paradigms involving aversive pictures.
Different neural substrates command the reactions of fear and anxiety.25,26 They are inter- and intra-connected, and act according to the distance of the threat.3 Experimental protocols that induce fear and anxiety favor the expression of defense reactions against natural or artificial dangerous situations,27,28 providing an understanding of ethological aspects and underlying neurobiology. The contradictory results found in the literature indicate the need for further studies to better explain defense reactions.
Physiological and parametric measures to supplement the stabilometric measures were also acquired in our study. Data from the STAI-S show that volunteers in the SP group had a statistically significant increase in anxiety scores in all phases of the experiment. As expected, the highest anxiety scores were recorded in phase F1, shortly after exposure to the task.
Regarding HR measures, volunteers in the SP group had an increase in this parameter before and after exposure to the test. This is an expected result, since participants were being exposed to an unfamiliar task. Differences between groups were also found in respect to the image categories. The SP group displayed increased HR in all categories when compared to CG.
Fowles29 argued that HR and other measures of sympathetic activation are more closely related to fear of a potential threat. This hypothesis is consonant with the results described herein, since HR increased in SP subjects when they were informed that they would view SPI (A), during task performance (imminence of aversive stimuli), and following exposure to feared stimuli (F1).
Concerning the parameters SCR and SF measured during the test, we found some statistically significant differences in both groups. During the task, skin conductance was significantly higher (only regarding SF) during exposure to the NE1 category (in both groups), and to the SPI category (in the SP group). Given that SF is sensitive to small fluctuations and plays an important role in inferring stress and anxiety, the high SF values from both groups while viewing the NE1 category can be interpreted as a response of anticipatory anxiety due to the start of an unknown task.29 Additionally, it can be assumed that this increase in the SP category was due to exposure to SPI images (anxiogenic for the SP group).
The results suggest that anxiety affected balance by increasing body sway. Establishing a parallel between the results found and the defense reactions described by Blanchard & Blanchard,4 we can suggest that the increase in body sway was related to an increment in defensive distance from the feared object. This response is associated with the perception of threat intensity and seems to be analogous to flight responses that, according to previous accounts, are usually seen in the face of an actual threat.
This study has some limitations. First, our population was limited to arachnophobia; we did not include patients with other phobic or anxiety disorders, such as panic or social anxiety. Also, the reduced sample size and the fact that participants were aware that they would view aversive pictures limit the statistical power and may have induced experimental bias. Finally, since the extent to which these visual picture tasks can be generalized to real-life situations is unclear, more recent studies have used real feared objects/situations or immersive virtual reality.30
The present findings can contribute to the understanding of defense reactions, especially in the field of SP. Future studies with larger samples and including patients with other psychiatric conditions can provide additional data to characterize simple phobia and its differentiation from other anxiety disorders, especially in situations which involve facing fear.
ACKNOWLEDGEMENTS
This study was supported by Fundação de Amparo à Pesquisa do Estado de São Paulo (FAPESP) and Institutos Nacionais de Ciência e Tecnologia (INCT), Conselho Nacional de Desenvolvimento Científico e Tecnológico (CNPq). AEN, FSG, JEH, AWZ, NCC, and JAC are recipients of CNPq productivity fellowships (1A). JAC has received a grant from the University Global Partnership Network (UGPN) - Global priorities in cannabinoid research excellence program.
The authors thank Mrs. Sandra Bernardo for her technical support.
Disclosure
FSG, JEH, AWZ, and JAC are coinventors of the patent "Fluorinated CBD compounds, compositions and uses thereof. Pub. No.: WO/2014/108899. International Application No.: PCT/IL2014/050023," Def. US number Reg. 62193296; July 29, 2015; INPI on August 19, 2015 (BR1120150164927; Mechoulam R, Zuardi AW, Kapczinski F, Hallak JEC, Guimarâes FS, Crippa JAS, Breuer A).
 PDF
 Print
 Send this article by email
 How to cite this article
 Submit a comment
 Mendeley
 Pocket
 Share on Facebook
 Share on Twitter