



ABSTRACT:
OBJECTIVE: Few pandemic studies have explored positive aspects of mental health employing an
intersectional perspective. Our intersectional investigation aimed to identify mental
illness and well-being differences between groups identified as psychologically vulnerable
during the pandemic by the World Health Organization (immigrants, minorities, and
people with psychiatric diagnoses) and people without pre-existing risk factors while
controlling for sociodemographic variables.
METHODS: This cross-sectional survey included 1,134 participants (76.1% women) aged 18 to 76
years. We used the Depression, Anxiety, and Stress Scales to assess mental disorders
and the Satisfaction with Life Scale and the Positive and Negative Affect Schedules
to assess well-being.
RESULTS: Through a variable-centered approach, multivariate analysis revealed significant mental
health differences between the groups: depression (F2.1131 = 72.7, p < 0.001), anxiety (F2.1131 = 78.0, p < 0.001), stress (F2.1131 = 85.9, p < 0.001), and subjective well-being (F2.1131 = 53.6, p < 0.001). The groups also differed when a person-centered approach was
used to analyze the variables jointly through latent profile analysis. We identified
six mental profiles consisting of different levels of depression, anxiety, stress,
and well-being. The risk and intersectional groups were more likely to be characterized
by the generalized suffering (ORrisk = 0.85, ORintersec = 0.93) and profound anguish (ORrisk&intersec = 0.97) profiles. After controlling for demographic variables, mental health disparities
were partially attributed to participant risk conditions.
CONCLUSIONS: Based on our results, we emphasize the urgent need for public health policies that
consider the specificities and vulnerabilities of minority and risk groups.
Keywords: Mental illness; well-being; mental health; Covid-19; intersectional.
FIGURES
| Received: December 30 2023; Accepted: March 26 2024 |
INTRODUCTION
A growing number of studies have indicated mental health disparities between the general population and minorities, immigrants, and people with prior psychiatric diagnoses.1-6 However, research has focused mainly on negative aspects of mental health, neglecting positive aspects. In addition, few studies have used an intersectional approach, which considers the simultaneous influence of different social aspects on disparities in physical and mental health. To address this gap in the literature, we explored mental health from an intersectional perspective.
Mental health disparities during the pandemic
In March 2020, the World Health Organization (WHO) declared the SARS-Cov-2 outbreak a global pandemic.7 The pandemic led to an abrupt change of routines, marked by an intense decline in social interaction and a profound economic recession.
At the beginning of the pandemic, the WHO predicted that certain population groups, including ethnic minorities, socially marginalized groups, and individuals with pre-existing mental health conditions, would be particularly vulnerable to mental health problems.8,9 Such groups would be at risk due to increased exposure to the negative indirect consequences of the pandemic, including, but not limited to, reduced access to essential health services, the adverse economic impact of pandemic containment measures, and increased stigma and discrimination.8,9 Recent studies have demonstrated that these groups indeed experienced more adverse mental health effects due to the crisis than the general population. People with previous health problems,1,2 immigrants,3,4 and minorities5,6 have been more affected by depression than the general population. It has also been found that people with previous health problems1,2 and immigrants3,4 have higher anxiety levels than the general population. In addition to a higher incidence of mental health problems, research has also shown that risk groups experienced lower well-being levels during the Covid-19 pandemic.10-12
Systematic reviews have confirmed a downturn in health among minority groups during the pandemic, as well as that few studies have used an intersectional approach to consider the concomitant impact of different risk factors on health.13-18
Intersectionality in pandemic studies
As a theoretical framework, intersectionality analyzes systems of power that affect marginalized social groups and produce social inequalities.19,20 From this perspective, the more people are affected by intersections of specific social axes (e.g., being a woman, an ethnic minority, an immigrant, having a physical or mental health condition, etc.), the more socially disadvantaged they are.21-23
Social disparities are reflected in observable psychological and physical health differences between groups. Minorities face higher levels of depression22,24-27 and stress27-31 and receive less mental health care.32,33 They are also more prone to conditions such as hypertension,34 obesity, smoking,35 and multiple chronic conditions.22 These inequalities are evident since youth and are perpetuated throughout life.36,37
The few studies that have explicitly used an intersectional approach to mental health during the pandemic have also identified health disparities during this period. Disadvantaged groups face a higher likelihood of depression,38,39 anxiety,39 and stress.40 It has also been found that indirect aspects negatively affect the mental health of intersectional groups, such as family rejection due to sexual preference,41 connections to undocumented immigrants,42 and lower perceived access to mental health services.43
While these studies have offered essential insights into mental health disparities between the general population and vulnerable groups during the pandemic, knowledge gaps persist. Only two intersectional studies addressed positive aspects of mental health,44,45 one of which relied on a single item to assess life satisfaction,45 which reduces the comparability of the results. The other study was the only one to consider sociodemographic variables when analyzing well-being,44 highlighting the need for further efforts to understand the influence of these variables on different groups. In addition to the above-mentioned study,45 only one other study has controlled for sociodemographic variables when comparing mental health between groups, but it used non-validated scales,42 which reduces the comparability of the results.
Thus, it is still uncertain whether the observed disparities stem from sociodemographic factors, such as education level, financial situation, or marital status,46,47 which have been shown to be significant determinants of mental health. The importance of analyzing the effects of sociodemographic factors on the mental health of intersectional groups is evident, since previous research has found that people with a higher education level, a better financial situation, and who are married generally report better mental health. However, pre-pandemic intersectional investigations have also shown that vulnerable populations face substantially worse sociodemographic conditions.
Additionally, intersectional studies have not considered the impact of Covid-19 infection among participants, which may have intensified mental health discrepancies. Minority groups were disproportionately affected and had higher mortality rates during the pandemic.48 In addition, research on other SARS epidemics has suggested that infected individuals are more likely to develop subsequent mental health problems.49 Furthermore, the mental health of individuals in more than one of the WHO's Covid-19 risk groups, such as immigrants, minorities, and those with pre-existing health conditions, has not yet been explored. So far, intersectional studies have focused on other social axes, such as sex and race,38,40,41,43,50,51 sex and ethnicity,39,42 sex and caste,52 and sex, race, religious affiliation, and ethnicity.44
Thus, we intended to expand several aspects of investigation into mental health disparities during the pandemic between advantaged and disadvantaged groups, i.e., whether disadvantaged groups were psychologically more vulnerable to the pandemic; whether mental illness disparities between the general population and risk and intersectional groups persisted in positive aspects of mental health, such as subjective well-being; the effects of single and combined variables on mental health differences; and the effects of sociodemographic factors and Covid-19 infection on mental health disparities between groups.
The intersectional perspective and study hypotheses
From an intersectional perspective, our goal was to assess the mental health level of participants and determine sociodemographic influences among individuals in the no-risk group (zero risk categories), the risk group (one risk category), and the intersectional risk group (multiple risk categories).8,9 We used a variable-centered approach to identify differences between the groups for each variable, followed by a person-centered approach53,54 to analyze the overall differences between groups, considering all variables together. In the variable-centered approach, we compared the mean mental illness and well-being of different groups, seeking to determine whether sociodemographic factors and Covid-19 infection explained mental health differences between groups.
We considered sociodemographic variables that have previously been identified as predictors of the investigated mental illnesses or of well-being, such as age,55,56 sex,2,57 education level, financial situation, and marital status,46,47 proposing the following three hypotheses:Through a person-centered approach, we aimed to determine whether the intra-subject dynamics between mental illness and well-being differed according to group. To do this, we performed a latent profile analysis, which identified different mental health profiles matched to each participant's level of mental illness and well-being. Subsequently, we analyzed whether the groups and sociodemographic variables could predict these different profiles. From this perspective, we proposed the following hypotheses:Hypothesis 1: Participants in the intersectional risk group will have higher mental illness scores than those in the risk group, who will have higher scores than those in the no-risk group.
Hypothesis 2: Participants in the intersectional risk group will have lower well-being scores than those in the risk group, who will have lower scores than the no-risk group.
Hypothesis 3: The mental health disparities between advantaged and disadvantaged groups will persist regardless of other sociodemographic variables.
Hypothesis 4: Mental health profiles with higher levels of mental illness and lower levels of well-being will be associated with participants in the risk and intersectional risk groups, while profiles with lower levels of mental illness and higher levels of well-being will be associated with the no-risk group.
Hypothesis 5: Sociodemographic variables will predict mental health profiles with a high level of mental illness and a low level of well-being, but they will not predict profiles with a low level of mental illness and a high level of well-being.
METHODS
Study design
This cross-sectional observational study was conducted from March to September 2021, coinciding with Europe's second wave of Covid-19.58 In February 2021, immediately before data collection began, Portugal recorded its highest Covid-19 death toll (28.1) and highest infection rate (5,627 cases per million inhabitants) during the pandemic.59 Data collection took place online via a LimeSurvey questionnaire. A pilot test with 27 participants of both sexes and varying ages assessed questionnaire comprehension and functionality. Recruitment relied on snowball sampling, e.g., e-mails sent to institutions such as universities, associations, schools, and hospitals, asking members to participate. Invitations were also shared randomly on social networks (Facebook, Instagram, and WhatsApp). A total of 1,141 respondents met inclusion criteria: age = 18 years, residence in Portugal during data collection, informed consent, and completing the questionnaire. Participants were informed of their ability to exit the questionnaire anytime and of a ?100 prize draw for those who completed it.
Participants
Most participants were women (n=869, 76.1%). The participants' ages ranged from 18 to 76 years (M = 36.1, SD = 14.9). Most had a high-school education (415 [36.3%]), were employed (582 [51%]), assessed their financial situation as reasonable (558 [48.9%]), and were married (303 [26.5%]). Of those who identified as another gender (n = 7), most were aged 18 to 42 years (M = 23.1, SD = 8.63), had completed primary education (5 [71.4%]), were single (6 [85.7%]), students (6 [85.7%]), and assessed their financial situation as good (5 [71.4%]).
Measures
The survey consisted of questions on sociodemographic characteristics (e.g., age, sex, occupation, education level), Covid-19 infection, and self-reported mental health scales. We present the findings regarding depression, stress, anxiety, life satisfaction, positive affect, and negative affect.
Group categorization
Initially, individuals in WHO-defined at-risk groups (previous psychiatric diagnoses, marginalized individuals, and migrants)8,9 were identified using three questions. Participants with a history of mental health disorders were identified through a positive response to: "Have you ever been medically diagnosed with a mental disorder?" Marginalized individuals were identified through a positive response to: "Do you identify with any minority group?" Those who indicated a nationality other than Portugal were considered immigrants. Following an intersectional perspective, participants were then classified into three groups: the no-risk group, consisting of those in zero risk categories (n=788, 69.5%); the risk group, consisting of those in one risk category (n=287, 25.3%); and the intersectional risk group, consisting of those in two or more risk categories (n=59, 5.20%).
Negative aspects of mental health
Mental illness was assessed using the Portuguese version of the Depression, Anxiety, and Stress Scale,60 a 21-symptom list rated on a four-point Likert scale. Confirmatory factor analysis showed three factors with good fit indices (?2[186] = 570, ?2/df = 3.06, p < 0.001; non-normed fit index = 0.998; comparative fit index = 0.998; root mean square error of approximation = 0.043), and all items had factor loadings > 0.65. Reliability indices for each subscale were satisfactory: stress (a = 0.912, ? = 0.914), anxiety (a = 0.890, ? = 0.892), and depression (a = 0.924, ? = 0.924). Severity levels were computed for each subscale, ranging from 0 to 21 points.
Positive aspects of mental health
The subjective well-being index was calculated by summing the mean scores of the Portuguese Satisfaction with Life Scale61 and the Positive Affect Schedule, and subtracting the Negative Affect Schedule.62 The Satisfaction with Life Scale assesses overall life satisfaction using five statements rated on a seven-point Likert scale. Principal axis factor analysis confirmed a one-factor model, accounting for 68% of the variance, and all items showed factor loadings > 0.74 with high reliability (a = 0.88).
The Positive Affect Negative Affect Schedule consists of 20 words describing positive (e.g., interested, proud) and negative (e.g., irritable, afraid) emotions rated on a five-point Likert-type scale. Confirmatory factor analysis showed a two-factor solution (?2[169] = 770, ?2/df = 4.55, p < 0.001; non-normed fit index = 0.975; comparative fit index = 0.978; root mean square error of approximation = 0.055), and all items had factor loading > 0.5, like the original study, except for item 3 (excited), which had a factor loading of 0.443; both subscales had high reliability (a = 0.90).
Data analysis strategy
Our study began with a comprehensive descriptive analysis to determine the variables' frequencies, percentages, means, and SD. We then applied chi-square tests to explore associations between sociodemographic factors and the groups. Skewness values < 3 and kurtosis values < 8 indicated normal distribution.63 Confirmatory factor analysis was then performed using diagonally weighted least squares for modeling; acceptable model fit was considered a comparative fit index = 0.95,64,65 a Tucker-Lewis index = 0.95,66 and a standardized root mean square residual = 0.08,67 along with significant chi-square results and a chi-square/degrees of freedom ratio < 5.63 Group means for illness and well-being were compared using analysis of variance with post-hoc Tukey's honestly significant difference test.
Hierarchical linear regressions were performed to determine the impact of sociodemographic variables and Covid-19 infection status (0 for non-infected, 1 for infected) on mental health outcomes. This analysis, performed in jamovi with a significance level of p < 0.05, was progressively extended by including dummy variables from the participants' social affiliations and exploring interactions between these groups and sociodemographic factors.
Intra-subject mental health dynamics were investigated with latent profile analysis, using robust maximum likelihood estimation in Mplus 8. We examined 1 to 12 profile solutions, determining the best model fit through the lowest values of Akaike's information criterion, Bayesian information criterion (BIC), sample-size adjusted BIC, Lo-Mendell-Rubin adjusted likelihood ratio test, and the significant p-value bootstrap likelihood ratio test, comparing a model of class k with a model of class k-1,68 and entropy with values = 0.80, indicating precise classification.69 Sociodemographic predictors of profile membership were identified through logistic regression in the optimal model, providing insight into the nuanced effects of sociodemographic variables on mental health profiles.
Ethics statement
The study was approved by the research ethics committee of the Faculdade de Psicologia e Ciências da Educação, Universidade do Porto (ref. 2020/11-3c) and the university's Unidade de Proteção de Dados (2020110315003174).
RESULTS
Variable-centered approach
The comparability of sociodemographic characteristics among the groups
The distribution of sociodemographic variables was generally similar among the groups, with slight variations, as shown in Supplementary Table S1. Standardized residuals analysis revealed fewer participants under 40 years of age in the no-risk group and more in the risk and intersectional risk groups than expected. Similarly, fewer people in the no-risk group rated their financial status as poor than in the risk and intersectional groups. Additionally, there were fewer non-students in the no-risk group than in the risk and intersectional risk groups. Despite this variance, Cramer's V values (0.16) indicated weak associations between the groups and the sociodemographic variables.
Mental health differences among sociodemographic characteristics
Those who were younger, without a university degree, with a poor or very poor financial situation, unmarried, and non-students, had higher mental illness and lower well-being levels (Supplementary Table S2). The effect sizes varied from small to medium (Cohen's d: 0.27 to 0.77), except for sex, which showed no significant differences across mental health variables. Sex differences were only significant for anxiety and subjective well-being, with tiny effect sizes (Supplementary Table S2).
Mental illness among the groups: hypotheses 1 and 2
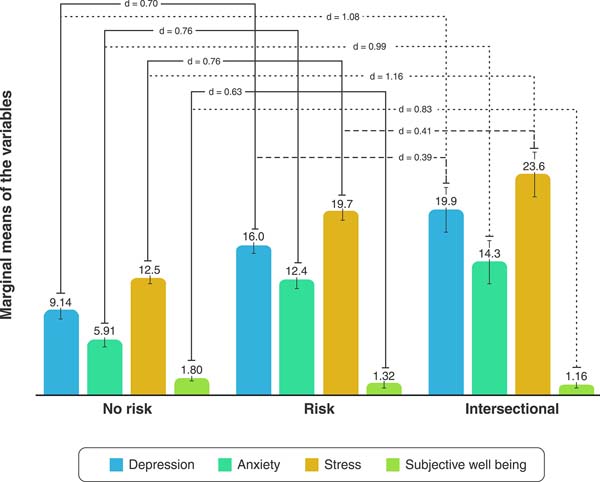
Multivariate analysis identified significant differences between the groups for depression (F2,1131 = 72.7, p < 0.001, ?2 = 0.11), anxiety (F2,1131 = 78.0, p < 0.001, ?2 = 0.12), stress (F2,1131 = 85.9, p < 0.001, ?2 = 0.13 ), and subjective well-being (F2,1131 = 53.6, p < 0.001, ?2 = 0.09 ), all of which had a medium effect size.
According to the Tukey test results, the no-risk group had significantly higher means for all mental health variables than the other two groups, with larger effect sizes. Finally, the intersectional risk group had higher means for depression and stress than the risk group, with a small effect size, as shown in Figure 1.
Sociodemographic variables as mental health predictors: hypothesis 3
Hierarchical linear regressions were performed to determine whether mental health disparities among groups could be attributed to sociodemographic characteristics. These regressions aimed to predict depression, anxiety, stress, and well-being, sequentially integrating sociodemographic variables, Covid-19 infection indicators, specific group variables, and interactions between group variables and other predictors.
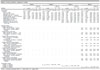
- Sociodemographic variables as predictors of depression
- Depression Model 1, which included sociodemographic variables alone, was significant (F6,1127 = 45.7; p < 0.001), explaining 19% of the variance in depression (Table 1). Notably, only sex did not have a significant impact on depression levels.
- The results were similar when the Covid-19 variable was incorporated in Model 2: neither sex nor Covid-19 was significant. The explained variance in depression increased by 7% (?R2 = 0.066) in Model 3, in which specific group variables were introduced, with group-related factors being significant and sex and Covid-19 infection remaining insignificant. In the final model, Model 4 (?F1,1126 = 0.26; ?p > 0.05; ?R2 < 0.001), interactions between group and sociodemographic variables were introduced, resulting in a 1% increase in the explained variance. Notably, education level lost direct significance in the intersectional risk group, although the interaction became significant, along with other interactions, such as risk group, sex and risk group, and employment status, as shown in Supplementary Figure S1a/S1b/S1c.
- Sociodemographic variables as predictors of anxiety
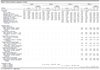
- Anxiety Model 1, which included only sociodemographic factors, was significant (F6,1127 = 19.0; p < 0.001), explaining a small portion of variance in anxiety, as shown in Table 2. Age and marital status did not significantly affect anxiety level. When the Covid-19 variable was added in Model 2, the results were similar (R2Adj = 0.09), although age, marital status, and Covid-19 remained insignificant. In Model 3, which included specific group variables, the explained variance in anxiety increased (?R2 = 0.09); these group-related factors were significant, while age, marital status, and Covid-19 were not. Interactions between group and sociodemographic variables were introduced in Model 4, resulting in a slight increase in the explained variance (?R2 = 0.025). Nevertheless, the effect and interaction of age, marital status, and Covid-19 infection remained insignificant. Notably, sex and education lost direct significance, but their interaction with groups became significant, as shown in Figure S1d/S1e.
- Sociodemographic variables as predictors of stress
- Stress Model 1, which only included sociodemographic variables, was significant (F6,1127 = 28.7; p < 0.001), explaining 13% of stress variance, as shown in Table 3. Notably, education level and marital status had no significant impact on stress level. When the Covid-19 variable was added in Model 2, the results were similar (R2Adj = 0.13), with education level, marital status, and Covid-19 remaining insignificant. When specific group variables were incorporated in Model 3, the explained variance increased (?R2 = 0.09) and group-related factors were significant, while education level, marital status, and Covid-19 remained insignificant. When interactions between group and sociodemographic variables were introduced in Model 4, there was a slight increase in the explained variation (?R2 = 0.014). Education level, marital status, and Covid-19 remained insignificant as fixed effects, but interactions between education level and group variables were significant, as shown in Figure S1f/S1g. Additionally, the interaction between sex and risk group was significant in this model.
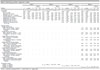
- Sociodemographic variables as predictors of subjective well-being
- Well-being Model 1, which included only sociodemographic variables, was significant (F6,1127 = 34.1; p < 0.001), explaining 15% of the variation in well-being, as shown in Table 4. Sex and education did not significantly influence well-being level. When the Covid-19 variable was added in Model 2, the results were similar (R2Adj = 0.15), with no significant values for sex, education, or Covid-19. When group variables were included in Model 3, the explained variance in well-being increased by 5%, with significant associations for group-related variables. However, age, education level, and Covid-19 remained insignificant. When interactions between group variables and other sociodemographic factors were included in Model 4, there was a slight increase in the explained variation (?R2 = 0.013). Only financial situation, employment status, and marital status had significant direct effects, although there were no significant interaction effects.
| Predictor | Model 1 | Model 2 | Model 3 | Model 4 | ||||||||||||||||
|---|---|---|---|---|---|---|---|---|---|---|---|---|---|---|---|---|---|---|---|---|
| b | p-value | ß | 95%CI | b | p-value | ß | 95%CI | b | p-value | ß | 95%CI | b | p-value | ß | 95%CI | |||||
| LL | UL | LL | UL | LL | UL | LL | UL | |||||||||||||
| Fixed effects | F6,1127 = 45.7, R2 = 0.20, R2Adj = 0.19 | F7,1126 = 39.2; R2 = 0.20, R2Adj = 0.19 | F9,1124 = 44.3; R2 = 0.28, R2Adj = 0.26 | F23,1110 = 18.6; R2 = 0.29, R2Adj = 0.26 | ||||||||||||||||
| Intercept | 22.8 | < 001 | 22.4 | < 0.001 | 19.1 | < 0.001 | 19.0 | < 0.001 | ||||||||||||
| Sex, ref. female | -0.88 | 0.19 | -0.08 | -0.21 | 0.04 | -0.86 | 0.20 | -0.08 | -0.21 | 0.04 | -0.85 | 0.19 | -0.08 | -0.20 | 0.04 | 0.12 | 0.88 | 0.01 | -0.13 | 0.15 |
| Age group, ref. younger | -3.23 | < 001 | -0.31 | -0.45 | -0.16 | -3.24 | < 0.001 | -0.31 | -0.45 | -0.16 | -2.83 | < 0.001 | -0.27 | -0.41 | -0.13 | -2.21 | 0.01 | -0.21 | -0.38 | -0.04 |
| Education level, ref. < university | -1.95 | 0.00 | -0.18 | -0.31 | -0.06 | -1.94 | 0.00 | -0.18 | -0.31 | -0.06 | -2.37 | < 0.001 | -0.22 | -0.34 | -0.11 | -1.11 | 0.15 | -0.11 | -0.25 | 0.04 |
| Financial situation, ref. poor or very poor | -6.11 | < 001 | -0.58 | -0.75 | -0.41 | -6.11 | < 0.001 | -0.58 | -0.75 | -0.41 | -4.88 | < 0.001 | -0.46 | -0.63 | -0.30 | -4.80 | < 0.001 | -0.45 | -0.68 | -0.23 |
| Employment, ref. no student | -3.43 | < 001 | -0.32 | -0.48 | -0.17 | -3.42 | < 0.001 | -0.32 | -0.48 | -0.17 | -2.86 | < 0.001 | -0.27 | -0.42 | -0.12 | -4.11 | < 0.001 | -0.39 | -0.57 | -0.21 |
| Marital status, ref. unmarried | -2.19 | < 001 | -0.21 | -0.32 | -0.09 | -2.19 | < 0.001 | -0.21 | -0.32 | -0.09 | -1.93 | 0.00 | -0.18 | -0.29 | -0.07 | -1.79 | 0.01 | -0.17 | -0.30 | -0.04 |
| Infected by Covid, ref. yes | - | - | - | - | - | 0.44 | 0.64 | 0.04 | -0.14 | 0.22 | 0.50 | 0.58 | 0.05 | -0.12 | 0.22 | -0.23 | 0.83 | -0.02 | -0.23 | 0.18 |
| Participant at risk, ref. no risk | - | - | - | - | - | - | - | - | - | - | 5.60 | < 0.001 | 0.53 | 0.41 | 0.65 | 5.97 | 0.03 | 0.57 | 0.06 | 1.08 |
| Participant at intersectional risk, ref. no risk | - | - | - | - | - | - | - | - | - | - | 7.75 | < 0.001 | 0.73 | 0.50 | 0.97 | 7.63 | 0.16 | 0.72 | -0.27 | 1.72 |
| Interaction effects | ||||||||||||||||||||
| Studied groups * Sex | ||||||||||||||||||||
| (Risk - No-risk) * (Male - Female) | - | - | - | - | - | - | - | - | - | - | - | - | - | - | - | -3.69 | 0.02 | -0.35 | -0.64 | -0.06 |
| (Intersectional - No-risk) * (Male - Female) | - | - | - | - | - | - | - | - | - | - | - | - | - | - | - | -0.58 | 0.84 | -0.06 | -0.58 | 0.47 |
| Studied groups * Age group | ||||||||||||||||||||
| (Risk - No-risk) * (> 40 age - < 40) | - | - | - | - | - | - | - | - | - | - | - | - | - | - | - | -2.96 | 0.09 | -0.28 | -0.61 | 0.04 |
| (Intersectional - No-risk) * (> 40 age - < 40) | - | - | - | - | - | - | - | - | - | - | - | - | - | - | - | 4.24 | 0.36 | 0.40 | -0.45 | 1.26 |
| Studied groups * Education level | ||||||||||||||||||||
| (Risk - No-risk) * (= University - < University) | - | - | - | - | - | - | - | - | - | - | - | - | - | - | - | -2.87 | 0.05 | -0.27 | -0.55 | 0.00 |
| (Intersectional - No-risk) * (= University - < University) | - | - | - | - | - | - | - | - | - | - | - | - | - | - | - | -7.23 | 0.01 | -0.68 | -1.20 | -0.17 |
| Studied groups * Financial situation | ||||||||||||||||||||
| (Risk - not risk) * (Reasonable to very good - poor or very poor) | - | - | - | - | - | - | - | - | - | - | - | - | - | - | - | -1.78 | 0.36 | -0.17 | -0.53 | 0.19 |
| (Intersectional - No-risk) * (Reasonable to very good - Bad or very poor) | - | - | - | - | - | - | - | - | - | - | - | - | - | - | - | 1.47 | 0.66 | 0.14 | -0.47 | 0.75 |
| Studied groups * Employment | ||||||||||||||||||||
| (Risk - No-risk) * (Student - Non-student) | - | - | - | - | - | - | - | - | - | - | - | - | - | - | - | 3.86 | 0.03 | 0.37 | 0.04 | 0.69 |
| (Intersectional - No-risk) * (Student - Non-student) | - | - | - | - | - | - | - | - | - | - | - | - | - | - | - | 0.07 | 0.98 | 0.01 | -0.63 | 0.64 |
| Studied groups * Marital status | ||||||||||||||||||||
| (Risk - No-risk) * (Married - Unmarried) | - | - | - | - | - | - | - | - | - | - | - | - | - | - | - | 0.29 | 0.84 | 0.03 | -0.23 | 0.28 |
| (Intersectional - No-risk) * (Married - Unmarried) | - | - | - | - | - | - | - | - | - | - | - | - | - | - | - | 0.23 | 0.94 | 0.02 | -0.53 | 0.57 |
| Groups * Covid infection | ||||||||||||||||||||
| (Risk - No-risk) * (Not infected - Infected) | - | - | - | - | - | - | - | - | - | - | - | - | - | - | - | 3.16 | 0.13 | 0.30 | -0.09 | 0.69 |
| (Intersectional - No-risk) * (Not infected - Infected) | - | - | - | - | - | - | - | - | - | - | - | - | - | - | - | 2.85 | 0.50 | 0.27 | -0.52 | 1.06 |
| Comparative models | ||||||||||||||||||||
| ? Model 1 vs. Model 2 | F1,1126 = 0.26, p > 0.05, ?R2 < 0.001 | |||||||||||||||||||
| ? Model 2 vs. Model 3 | F2,1124 = 50.3, p < 0.001, ?R2 = 0.07 | |||||||||||||||||||
| ? Model 3 vs. Model 4 | F14,1110 = 1.74, p < 0.05, ?R2 = 0.02 | |||||||||||||||||||
LL = lower limits; UL = upper limits.
| Predictor | Model 1 | Model 2 | Model 3 | Model 4 | ||||||||||||||||
|---|---|---|---|---|---|---|---|---|---|---|---|---|---|---|---|---|---|---|---|---|
| b | p-value | ß | 95% CI | b | p-value | ß | 95% CI | b | p-value | ß | 95% CI | b | p-value | ß | 95% CI | |||||
| LL | UL | LL | UL | LL | UL | LL | UL | |||||||||||||
| Fixed effects | F6,1127 = 19.0; R2 = 0.09, R2Adj = 0.09 | F7,1126 = 16.2; R2 = 0.09, R2Adj = 0.09 | F9,1124 = 27.8; R2 = 0.18, R2Adj = 0.18 | F23,1110 = 12.6; R2 = 0.21, R2Adj = 0.19 | ||||||||||||||||
| Intercept | 14.7 | < 0.001 | 15.0 | < 0.001 | 11.7 | < 0.001 | 11.3 | < 0.001 | ||||||||||||
| Sex, ref. female | -1.33 | 0.03 | -0.15 | -0.28 | -0.01 | -1.34 | 0.03 | -0.15 | -0.28 | -0.02 | -1.30 | 0.03 | -0.14 | -0.27 | -0.02 | -0.70 | 0.31 | -0.08 | -0.23 | 0.07 |
| Age group, ref. younger | -1.26 | 0.08 | -0.14 | -0.29 | 0.02 | -1.25 | 0.08 | -0.14 | -0.29 | 0.02 | -0.86 | 0.21 | -0.09 | -0.24 | 0.05 | -0.46 | 0.57 | -0.05 | -0.22 | 0.12 |
| Education level, ref. < university | -1.42 | 0.02 | -0.16 | -0.29 | -0.03 | -1.43 | 0.02 | -0.16 | -0.29 | -0.03 | -1.86 | 0.00 | -0.21 | -0.33 | -0.08 | -0.56 | 0.42 | -0.06 | -0.21 | 0.09 |
| Financial situation, ref. poor or very poor | -3.39 | < 0.001 | -0.37 | -0.55 | -0.19 | -3.39 | < 0.001 | -0.37 | -0.55 | -0.19 | -2.18 | 0.01 | -0.24 | -0.41 | -0.07 | -2.18 | 0.04 | -0.24 | -0.47 | -0.01 |
| Employment, ref. student | -2.58 | < 0.001 | -0.28 | -0.45 | -0.12 | -2.58 | < 0.001 | -0.28 | -0.45 | -0.12 | -2.02 | 0.01 | -0.22 | -0.38 | -0.07 | -3.11 | < 0.001 | -0.34 | -0.53 | -0.15 |
| Marital Status, ref. unmarried | -0.98 | 0.09 | -0.11 | -0.23 | 0.02 | -0.98 | 0.09 | -0.11 | -0.23 | 0.02 | -0.71 | 0.19 | -0.08 | -0.20 | 0.04 | -0.97 | 0.14 | -0.11 | -0.25 | 0.03 |
| Covid infection, ref. yes | - | - | - | - | - | -0.28 | 0.75 | -0.03 | -0.22 | 0.16 | -0.22 | 0.79 | -0.02 | -0.20 | 0.16 | -0.24 | 0.81 | -0.03 | -0.24 | 0.19 |
| Participant at risk, ref. no risk | - | - | - | - | - | - | - | - | - | - | 5.86 | < 0.001 | 0.65 | 0.52 | 0.77 | 6.46 | 0.01 | 0.71 | 0.18 | 1.25 |
| Participant at intersectional risk, ref. no risk | - | - | - | - | - | - | - | - | - | - | 6.99 | < 0.001 | 0.77 | 0.52 | 1.01 | 13.64 | 0.01 | 1.50 | 0.46 | 2.55 |
| Interaction effects | ||||||||||||||||||||
| Studied groups * Sex | ||||||||||||||||||||
| (Risk - No-risk) * (Male - Female) | - | - | - | - | - | - | - | - | - | - | - | - | - | - | - | -3.49 | 0.01 | -0.38 | -0.68 | -0.08 |
| (Intersectional - No-risk) * (Male - Female) | - | - | - | - | - | - | - | - | - | - | - | - | - | - | - | 4.05 | 0.11 | 0.45 | -0.11 | 1.00 |
| Studied groups * Age group | ||||||||||||||||||||
| (Risk - No-risk) * (> 40 age - < 40) | - | - | - | - | - | - | - | - | - | - | - | - | - | - | - | -1.87 | 0.24 | -0.21 | -0.55 | 0.13 |
| (Intersectional - No-risk) * (> 40 age - < 40) | - | - | - | - | - | - | - | - | - | - | - | - | - | - | - | 3.30 | 0.43 | 0.36 | -0.53 | 1.26 |
| Studied groups * Education level | ||||||||||||||||||||
| (Risk - No-risk) * (= University - < University) | - | - | - | - | - | - | - | - | - | - | - | - | - | - | - | -2.87 | 0.03 | -0.32 | -0.60 | -0.03 |
| (Intersectional - No-risk) * (= University - < University) | - | - | - | - | - | - | - | - | - | - | - | - | - | - | - | -9.42 | < 0.001 | -1.04 | -1.58 | -0.49 |
| Studied groups * Financial situation | ||||||||||||||||||||
| (Risk - No-risk) * (Reasonable to very good - Poor or very poor) | - | - | - | - | - | - | - | - | - | - | - | - | - | - | - | -1.13 | 0.52 | -0.12 | -0.50 | 0.25 |
| (Intersectional - No-risk) * (Reasonable to very good - Poor or very poor) | - | - | - | - | - | - | - | - | - | - | - | - | - | - | - | -1.59 | 0.59 | -0.18 | -0.82 | 0.47 |
| Studied groups * Employment | ||||||||||||||||||||
| (Risk - No-risk) * (Student - Non-student) | - | - | - | - | - | - | - | - | - | - | - | - | - | - | - | 2.79 | 0.08 | 0.31 | -0.03 | 0.65 |
| (Intersectional - No-risk) * (Student - Non-student) | - | - | - | - | - | - | - | - | - | - | - | - | - | - | - | 3.62 | 0.24 | 0.40 | -0.27 | 1.07 |
| Studied groups * Marital status | ||||||||||||||||||||
| (Risk - No-risk) * (Married - Unmarried) | - | - | - | - | - | - | - | - | - | - | - | - | - | - | - | 2.26 | 0.07 | 0.25 | -0.02 | 0.52 |
| (Intersectional - No-risk) * (Married - Unmarried) | - | - | - | - | - | - | - | - | - | - | - | - | - | - | - | -1.40 | 0.60 | -0.15 | -0.73 | 0.42 |
| Studied groups * Covid infection | ||||||||||||||||||||
| (Risk - No-risk) * (Not infected - Infected) | - | - | - | - | - | - | - | - | - | - | - | - | - | - | - | 1.30 | 0.49 | 0.14 | -0.27 | 0.55 |
| (Intersectional - No-risk) * (Not infected - Infected) | - | - | - | - | - | - | - | - | - | - | - | - | - | - | - | -2.66 | 0.49 | -0.29 | -1.12 | 0.53 |
| Comparative models | ||||||||||||||||||||
| ? Model 1 vs. Model 2 | F1,1126 = 0.10, p > 0.05, ?R2 < 0.001 | |||||||||||||||||||
| ? Model 2 vs. Model 3 | F2,1124 = 62.1, p < 0.001, ?R2 = 0.09 | |||||||||||||||||||
| ? Model 3 vs. Model 4 | F14,1110 = 2.51, p > 0.05, ?R2 = 0.03 | |||||||||||||||||||
Covid = coronavirus disease 2019; LL = lower limits; UL = upper limits.
| Predictor | Model 1 | Model 2 | Model 3 | Model 4 | ||||||||||||||||
|---|---|---|---|---|---|---|---|---|---|---|---|---|---|---|---|---|---|---|---|---|
| b | p-value | ß | 95%CI | b | p-value | ß | 95%CI | b | p-value | ß | 95%CI | b | p-value | ß | 95%CI | |||||
| LL | UL | LL | UL | LL | UL | LL | UL | |||||||||||||
| Fixed effects | F6,1127 = 28.7; R2 = 0.13, R2Adj = 0.13 | F7,1126 = 24.6; R2 = 0.13, R2Adj = 0.13 | F9,1124 = 35.6; R2 = 0.22, R2Adj = 0.22 | F23,1110 = 12.9; R2 = 0.24, R2Adj = 0.22 | ||||||||||||||||
| Intercept | 22.4 | < 0.001 | 22.7 | < 0.001 | 19.0 | < 0.001 | 18.6 | < 0.001 | ||||||||||||
| Sex, ref. female | -2.37 | < 0.001 | -0.23 | -0.36 | -0.10 | -2.38 | < 0.001 | -0.23 | -0.36 | -0.10 | -2.37 | < 0.001 | -0.23 | -0.36 | -0.11 | -1.60 | 0.04 | -0.16 | -0.30 | -0.01 |
| Age group, ref. younger | -2.99 | < 0.001 | -0.29 | -0.44 | -0.14 | -2.99 | < 0.001 | -0.29 | -0.44 | -0.14 | -2.53 | < 0.001 | -0.25 | -0.39 | -0.10 | -2.32 | 0.01 | -0.23 | -0.40 | -0.06 |
| Education level, ref. < university | -0.07 | 0.92 | -0.01 | -0.13 | 0.12 | -0.07 | 0.92 | -0.01 | -0.13 | 0.12 | -0.54 | 0.39 | -0.05 | -0.17 | 0.07 | 0.71 | 0.35 | 0.07 | -0.08 | 0.22 |
| Financial situation, ref. poor or very poor | -3.70 | < 0.001 | -0.36 | -0.54 | -0.19 | -3.70 | < 0.001 | -0.36 | -0.54 | -0.19 | -2.31 | 0.01 | -0.23 | -0.40 | -0.06 | -2.46 | 0.04 | -0.24 | -0.47 | -0.01 |
| Employment, ref. student | -3.90 | < 0.001 | -0.38 | -0.54 | -0.22 | -3.90 | < 0.001 | -0.38 | -0.54 | -0.22 | -3.26 | < 0.001 | -0.32 | -0.47 | -0.17 | -3.99 | < 0.001 | -0.39 | -0.58 | -0.20 |
| Marital status, ref. unmarried | -0.43 | 0.49 | -0.04 | -0.16 | 0.08 | -0.43 | 0.49 | -0.04 | -0.16 | 0.08 | -0.14 | 0.81 | -0.01 | -0.13 | 0.10 | -0.38 | 0.59 | -0.04 | -0.18 | 0.10 |
| Covid infection, ref. yes | - | - | - | - | - | -0.33 | 0.73 | -0.03 | -0.22 | 0.15 | -0.26 | 0.78 | -0.03 | -0.20 | 0.15 | -0.33 | 0.76 | -0.03 | -0.24 | 0.18 |
| Participant at risk, ref. no risk | - | - | - | - | - | - | - | - | - | - | 6.20 | < 0.001 | 0.61 | 0.49 | 0.73 | 7.18 | 0.01 | 0.70 | 0.18 | 1.23 |
| Participant at intersectional risk, ref. no risk | - | - | - | - | - | - | - | - | - | - | 9.06 | < 0.001 | 0.89 | 0.65 | 1.13 | 13.04 | 0.02 | 1.28 | 0.25 | 2.30 |
| Interaction effects | ||||||||||||||||||||
| Studied groups * Sex | ||||||||||||||||||||
| (Risk - No-risk) * (Male - Female) | - | - | - | - | - | - | - | - | - | - | - | - | - | - | - | -3.83 | 0.01 | -0.38 | -0.67 | -0.08 |
| (Intersectional - No-risk) * (Male - Female) | - | - | - | - | - | - | - | - | - | - | - | - | - | - | - | 3.49 | 0.22 | 0.34 | -0.20 | 0.88 |
| Studied groups * Age group | ||||||||||||||||||||
| (Risk - No-risk) * (> 40 age - < 40) | - | - | - | - | - | - | - | - | - | - | - | - | - | - | - | -1.31 | 0.45 | -0.13 | -0.46 | 0.21 |
| (Intersectional - No-risk) * (> 40 age - < 40) | - | - | - | - | - | - | - | - | - | - | - | - | - | - | - | 3.57 | 0.44 | 0.35 | -0.53 | 1.23 |
| Studied groups * Education level | ||||||||||||||||||||
| (Risk - No-risk) * (= University - < University) | - | - | - | - | - | - | - | - | - | - | - | - | - | - | - | -3.55 | 0.02 | -0.35 | -0.63 | -0.07 |
| (Intersectional - No-risk) * (= University - < University) | - | - | - | - | - | - | - | - | - | - | - | - | - | - | - | -6.05 | 0.03 | -0.59 | -1.13 | -0.06 |
| Studied groups * Financial situation | ||||||||||||||||||||
| (Risk - No-risk) * (Reasonable to very good - Bad or very poor) | - | - | - | - | - | - | - | - | - | - | - | - | - | - | - | -0.26 | 0.89 | -0.03 | -0.40 | 0.35 |
| (Intersectional - No-risk) * (Reasonable to very good - Bad or very poor) | - | - | - | - | - | - | - | - | - | - | - | - | - | - | - | -1.24 | 0.71 | -0.12 | -0.75 | 0.51 |
| Studied groups * Employment | ||||||||||||||||||||
| (Risk - No-risk) * (Student - Non-student) | - | - | - | - | - | - | - | - | - | - | - | - | - | - | - | 2.47 | 0.16 | 0.24 | -0.09 | 0.57 |
| (Intersectional - No-risk) * (Student - Non-student) | - | - | - | - | - | - | - | - | - | - | - | - | - | - | - | -1.46 | 0.67 | -0.14 | -0.80 | 0.51 |
| Studied groups * Marital status | ||||||||||||||||||||
| (Risk - No-risk) * (Married - Unmarried) | - | - | - | - | - | - | - | - | - | - | - | - | - | - | - | 1.53 | 0.26 | 0.15 | -0.11 | 0.41 |
| (Intersectional - No-risk) * (Married - Unmarried) | - | - | - | - | - | - | - | - | - | - | - | - | - | - | - | 1.16 | 0.70 | 0.11 | -0.46 | 0.68 |
| Studied groups * Covid infection | ||||||||||||||||||||
| (Risk - No-risk) * (Not infected - infected) | - | - | - | - | - | - | - | - | - | - | - | - | - | - | - | 1.02 | 0.63 | 0.10 | -0.30 | 0.50 |
| (Intersectional - No-risk) * (Not infected - Infected) | - | - | - | - | - | - | - | - | - | - | - | - | - | - | - | -1.53 | 0.72 | -0.15 | -0.96 | 0.66 |
| Comparative models | ||||||||||||||||||||
| ? Model 1 vs. Model 2 | F1,1126 = 0.12, p > 0.05, ?R2 < 0.001 | |||||||||||||||||||
| ? Model 2 vs. Model 3 | F2, 1124 = 64.6, p < .001, ?R2 = 0.09 | |||||||||||||||||||
| ? Model 3 vs. Model 4 | F14, 1110 = 1.47, p > 0.05, ?R2 = 0.01 | |||||||||||||||||||
LL = lower limits; UL = upper limits.
| Predictor | Model 1 | Model 2 | Model 3 | Model 4 | ||||||||||||||||
|---|---|---|---|---|---|---|---|---|---|---|---|---|---|---|---|---|---|---|---|---|
| b | p-value | ß | 95%CI | b | p-value | ß | 95%CI | b | p-value | ß | 95%CI | b | p-value | ß | 95%CI | |||||
| LL | UL | LL | UL | LL | UL | LL | UL | |||||||||||||
| Fixed effects | F6,1127 = 34.1; R2 = 0.15, R2Adj = 0.15 | F7,1126 = 29.3; R2 = 0.15, R2Adj = 0.15 | F9,1124 = 31.9; R2 = 0.20, R2Adj = 0.20 | F23,1110 = 13.2; R2 = 0.22, R2Adj = 0.20 | ||||||||||||||||
| Intercept | 3.00 | < 0.001 | 3.11 | < 0.001 | 3.36 | < 0.001 | 3.28 | < 0.001 | ||||||||||||
| Sex, ref. female | -0.16 | 0.07 | -0.12 | -0.25 | 0.01 | -0.17 | 0.06 | -0.12 | -0.25 | 0.01 | -0.17 | 0.05 | -0.13 | -0.25 | 0.00 | -0.19 | 0.08 | -0.14 | -0.29 | 0.01 |
| Age group, ref. younger | 0.00 | 0.98 | 0.00 | -0.15 | 0.15 | 0.00 | 0.96 | 0.00 | -0.15 | 0.15 | -0.02 | 0.82 | -0.02 | -0.17 | 0.13 | 0.00 | 0.98 | 0.00 | -0.18 | 0.18 |
| Education level, ref. < university | 0.12 | 0.19 | 0.09 | -0.04 | 0.21 | 0.12 | 0.19 | 0.08 | -0.04 | 0.21 | 0.15 | 0.09 | 0.11 | -0.02 | 0.24 | 0.09 | 0.38 | 0.07 | -0.08 | 0.22 |
| Financial situation, ref. poor or very poor | 1.30 | < 0.001 | 0.95 | 0.77 | 1.12 | 1.30 | < 0.001 | 0.95 | 0.77 | 1.12 | 1.21 | < 0.001 | 0.88 | 0.71 | 1.06 | 1.24 | < 0.001 | 0.91 | 0.67 | 1.15 |
| Employment, ref. student | 0.09 | 0.40 | 0.07 | -0.09 | 0.23 | 0.09 | 0.40 | 0.07 | -0.09 | 0.22 | 0.05 | 0.65 | 0.04 | -0.12 | 0.19 | 0.16 | 0.24 | 0.12 | -0.08 | 0.31 |
| Marital status, ref. unmarried | 0.43 | < 0.001 | 0.32 | 0.20 | 0.44 | 0.43 | < 0.001 | 0.32 | 0.20 | 0.44 | 0.41 | < 0.001 | 0.30 | 0.18 | 0.42 | 0.30 | 0.00 | 0.22 | 0.08 | 0.37 |
| Infected by Covid, ref. yes | - | - | - | - | - | -0.12 | 0.36 | -0.09 | -0.27 | 0.10 | -0.12 | 0.33 | -0.09 | -0.27 | 0.09 | -0.05 | 0.77 | -0.03 | -0.25 | 0.19 |
| Participant at risk, ref. no risk | - | - | - | - | - | - | - | - | - | - | -0.47 | < 0.001 | -0.34 | -0.47 | -0.22 | -0.42 | 0.27 | -0.31 | -0.85 | 0.24 |
| Participant at intersectional risk, ref. no risk | - | - | - | - | - | - | - | - | - | - | -0.44 | 0.01 | -0.32 | -0.57 | -0.08 | 0.54 | 0.47 | 0.39 | -0.68 | 1.46 |
| Interaction effects | ||||||||||||||||||||
| Studied groups * Sex | ||||||||||||||||||||
| (Risk - No-risk) * (Male - Female) | - | - | - | - | - | - | - | - | - | - | - | - | - | - | - | 0.10 | 0.64 | 0.07 | -0.24 | 0.38 |
| (Intersectional - No-risk) * (Male - Female) | - | - | - | - | - | - | - | - | - | - | - | - | - | - | - | -0.12 | 0.76 | -0.09 | -0.65 | 0.48 |
| Studied groups * Age group | ||||||||||||||||||||
| (Risk - No-risk) * (> 40 age - < 40) | - | - | - | - | - | - | - | - | - | - | - | - | - | - | - | -0.15 | 0.54 | -0.11 | -0.46 | 0.24 |
| (Intersectional - No-risk) * (> 40 age - < 40) | - | - | - | - | - | - | - | - | - | - | - | - | - | - | - | 0.21 | 0.75 | 0.15 | -0.77 | 1.07 |
| Studied groups * Education level | ||||||||||||||||||||
| (Risk - No-risk) * (= University - < University) | - | - | - | - | - | - | - | - | - | - | - | - | - | - | - | 0.17 | 0.40 | 0.13 | -0.17 | 0.42 |
| (Intersectional - No-risk) * (= University - < University) | - | - | - | - | - | - | - | - | - | - | - | - | - | - | - | -0.04 | 0.92 | -0.03 | -0.59 | 0.53 |
| Studied groups * Financial situation | ||||||||||||||||||||
| (Risk - No-risk) * (Reasonable to very good - Poor or very poor) | - | - | - | - | - | - | - | - | - | - | - | - | - | - | - | 0.08 | 0.77 | 0.06 | -0.33 | 0.45 |
| (Intersectional - No-risk) * (Reasonable to very good - Poor or very poor) | - | - | - | - | - | - | - | - | - | - | - | - | - | - | - | -0.59 | 0.20 | -0.43 | -1.09 | 0.23 |
| Studied groups * Employment | ||||||||||||||||||||
| (Risk - No-risk) * (Student - Non-student) | - | - | - | - | - | - | - | - | - | - | - | - | - | - | - | -0.23 | 0.33 | -0.17 | -0.52 | 0.18 |
| (Intersectional - No-risk) * (Student - Non-student) | - | - | - | - | - | - | - | - | - | - | - | - | - | - | - | -0.61 | 0.20 | -0.45 | -1.13 | 0.24 |
| Studied groups * Marital status | ||||||||||||||||||||
| (Risk - No-risk) * (Married - Unmarried) | - | - | - | - | - | - | - | - | - | - | - | - | - | - | - | 0.21 | 0.27 | 0.15 | -0.12 | 0.43 |
| (Intersectional - No-risk) * (Married - Unmarried) | - | - | - | - | - | - | - | - | - | - | - | - | - | - | - | 0.79 | 0.06 | 0.58 | -0.02 | 1.17 |
| Groups * Covid infection | ||||||||||||||||||||
| (Risk - No-risk) * (Not infected - Infected) | - | - | - | - | - | - | - | - | - | - | - | - | - | - | - | -0.21 | 0.48 | -0.15 | -0.57 | 0.27 |
| (Intersectional - No-risk) * (Not infected - Infected) | - | - | - | - | - | - | - | - | - | - | - | - | - | - | - | -0.72 | 0.22 | -0.53 | -1.38 | 0.32 |
| Comparative models | ||||||||||||||||||||
| ? Model 1 vs. Model 2 | F1,1126 = 0.82, p > 0.05, ?R2 < 0.001 | |||||||||||||||||||
| ? Model 2 vs. Model 3 | F2,1124 = 34.6, p < 0.001, ?R2 = 0.05 | |||||||||||||||||||
| ? Model 3 vs. Model 4 | F14,1110 = 1.17, p > 0.05, ?R2 = 0.01 | |||||||||||||||||||
Covid = coronavirus disease 2019; LL = lower limits; UL = upper limits.
Person-centered approach
Mental health profiles: hypothesis 4
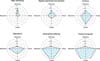
The fit indices (Supplementary Table S3) reflect continual improvement in log-likelihood, Akaike's information criterion, BIC, and sample-size adjusted BIC with each additional profile, although they did not reach a minimum. However, the increment in Akaike's information criterion, BIC, and sample-size adjusted BIC from the model's transition expressively reduced between the sixth and seventh profiles. Bootstrap likelihood ratio test values consistently < 0.001 indicated improvement in the model with each additional profile. Entropy values declined from the second model onward. The transition from a five- to six-profile solution added a distinct profile, while the six- to seven-profile transition did not. Considering the plateau in Akaike's information criterion, BIC, and sample-size adjusted BIC reductions, the decrease in entropy, and theoretical evolution, we selected the six-profile model due to its better theoretical relevance and analytical adequacy.
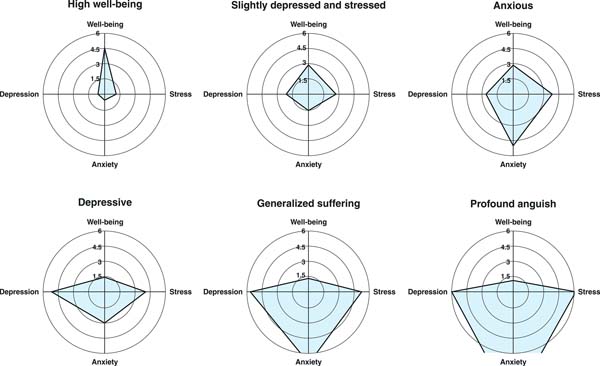
The six identified mental health profiles are presented in a progressive sequence, starting with the high well-being profile (profile 1), which characterized 42% of the participants and involved a superficial level of mental illness and a high level of well-being. On the other end of the spectrum, the profound anguish profile (profile 6), which characterized 4.06% of the participants, involved a higher level of all mental illness variables and a lower level of well-being, as shown in Figure 2. Profile 2, slightly depressed and stressed, which represented individuals with high levels of subjective well-being but with mild levels of depression and stress, characterized 26.5% of the participants. Profile 3, anxious, which represented individuals with depression-like levels of subjective well-being, moderate stress levels, and different anxiety levels, characterized 11% of the participants. Profile 4, depressive, which represented individuals with a low level of subjective well-being, moderate stress levels, and different depression levels, characterized 8.11% of the participants. Profile 5, generalized suffering, represented individuals with a low level of subjective well-being and different levels of depression, anxiety, and stress, characterized 8.38% of the participants.
Sociodemographic variables as profile predictors: hypothesis 5
Our multinomial logistic regressions showed that sociodemographic variables had a weak influence on the likelihood of belonging to various mental health profiles, as detailed in Supplementary Table S4. Younger age was associated with a higher odds of having an anxious (odds ratio [OR] = 0.93) or profound anguish (OR = 0.93) profile, rather than a high well-being profile. A lower education level reduced the likelihood of a high well-being (OR = 0.37) or slightly depressed and stressed (OR = 0.37) profile compared to a profound anguish profile. A poor financial situation decreased the odds of having a high well-being profile (OR = 0.22) compared to a profound anguish profile.
Covid-19 infection was not a significant predictor of mental health profile. Regarding the influence of group identification on participant profile, those in the risk group were least likely to have a high well-being profile. There was a trend toward a lower probability of having a high well-being profile in the risk group than profiles involving mental illness. The risk group was also most likely to have a profound anguish profile.
Participants in the intersectional risk group were less likely to have a high well-being than a generalized suffering or profound anguish profile, with no significant differences for other profiles. They were more likely to have profound anguish than any other profile, except anxious, which had no significant probability differences.
DISCUSSION
To the best of our knowledge, our study is the first to investigate the mental health of migrants, minorities, and people with a history of mental health problems, considered risk groups by the WHO in relation to Covid-19, from an intersectional perspective.8,9 Consistent with hypotheses 1 and 2, the intersectional risk group had a higher rate of mental illness and lower well-being than the no-risk group. They also reported higher depression and stress levels than the risk group, although well-being and anxiety did not significantly differ, as expected. Despite these similar outcomes between the risk and intersectional risk groups, the effect size between the no-risk and intersectional risk groups was notably more prominent, indicating a progressive deterioration in mental health across groups. This finding indicates persistent disparities in negative aspects of mental health, with disadvantaged groups suffering not only from a higher prevalence of mental disorders but from lower general well-being.
These findings align with previous research about mental health disparities between advantaged and disadvantaged groups during the pandemic.1-6 Our findings also corroborate other intersectional studies conducted during the pandemic, although they focused on different conditions of vulnerability, such as sex, race, caste, religion, and ethnicity.38-43 This shows the importance of recognizing the complex intersection of identities and social conditions in mental health care.
Our results, which support hypothesis 3, demonstrate that sociodemographic factors were associated with mental health disparities. Like previous research,46,47,55-57 our general sample showed that students, younger individuals, those with lower education, single individuals, and those with a poor perceived financial situation reported the lowest levels of mental health. These patterns persisted even after accounting for the mutual influence of sociodemographic variables. This trend may be partially explained by the conditions of the pandemic, such as social isolation, which affected young people more intensely, as well as financial instability, which was exacerbated by reduced income (in Portugal, for example, it was reduced by two-thirds).
After controlling for sociodemographic variables, participant vulnerability, whether due to a single or multiple factors, was responsible for a significant increase in mental illness variance in the different models. The conditions of the pandemic could also partly explain this disparity. Social isolation, exacerbated by the pandemic, acutely impacted disadvantaged groups, such as those with previously diagnosed mental disorders, who had difficulty continuing their treatment,70 as well as gender and ethnic minorities, whose limited support networks were further reduced.71
Our analyses also revealed that some sociodemographic variables had a distinct influence on the groups. Mental illness disparities between groups were more pronounced among women than men, which is in line with intersectional principles, i.e., that women are more exposed to adverse conditions, resulting in poorer levels of mental health.21-23 On the other hand, education reduced these disparities, possibly due to its role in social integration,72 which is crucial since disadvantaged groups are more susceptible to marginalization and loneliness.73 Education level may also influence income, mitigating negative perceptions about finances, which were detrimental to mental health in our study.
The person-centered approach revealed a spectrum of six distinct mental health profiles, broadening the dichotomy between the groups with the best and worst mental health identified in the variable-centered analysis. The six profiles showed nuanced intra-subject mental health, characterized by relatively similar levels of different mental illnesses and inversely proportional levels of well-being. These results support the conception of mental health as multidetermined by positive and negative factors,74 which are correlated axes, challenging the simplistic notion that mental health and illness lie at opposite ends of a continuum.
The recognition that individuals in the risk and intersectional risk groups tend to align with the most adverse mental health profiles partially supports hypothesis 4. However, the best mental health profile predominantly consisted of participants without risk factors, although this distinction did not remain significant when compared with the intersectional risk group. In addition, the lack of a consistent association between sociodemographic variables and mental health profiles, apart from the financial situation, contradicts hypothesis 5 and indicates the need to explore other mechanisms that could influence these relationships.
Finally, our findings indicate that Covid-19 infection did not directly impact mental health, which aligns with previous Portuguese studies.75 However, intensive care patients had elevated stress and depression levels,76 suggesting that infection severity can affect mental health.
In addition to the above-mentioned implications of the pandemic, we assume that other aspects are involved in mental health disparities between groups. Future research should identify whether people at intersectional risk are concomitantly affected by different aspects of mental health, such as loneliness, racism, and stigmatization, which negatively impact the mental health of disadvantaged groups. The relationship between positive and negative aspects of mental health that we identified warrant further investigation with confirmatory methodologies that are more resistant to spurious variables, such as network analysis.
Further studies with larger samples are needed to analyze the impact of intersectionality on an even broader range of marginalized identities and axes of oppression. Such research is necessary for clinical interventions and public policies that, in order to promote mental health equity, recognize and address the complexities of these groups' experiences.
Finally, our study has certain limitations, which directly affect the interpretation and generalization of our findings. Our data were self-reported, which may have introduced self-perception bias to the results. Our sample was also unbalanced in terms of sex, education level, and economic status. Furthermore, given that it was conducted in a single country, caution should be used when generalizing the results to other regions.
In conclusion, based on our results, we emphasize the urgent need for public health policies that consider the specificities and vulnerabilities of minority and risk groups. Implementing strategies that address not only social determinants of health but promote a more equitable and inclusive environment is critical to reducing mental health disparities. Education about racism and discrimination, coupled with changing racist policies and stereotypes, can play a vital role in building more resilient societies and supporting the mental health of all individuals, especially those most at risk of marginalization and mental illness.
ACKNOWLEDGEMENTS
CJF received a scholarship from the Fundação para a Ciência e Tecnologia through the Fundo Social Europeu and the Programa Operacional Regional do Norte (NORTE 2020).
 PDF
 Print
 Send this article by email
 How to cite this article
 Submit a comment
 Mendeley
 Pocket
 Share on Facebook
 Share on Twitter