



ABSTRACT:
OBJECTIVE: Some months after the remission of acute COVID-19, some individuals show depressive
symptoms, which are predicted by increased peak body temperature (PBT) and decreased
blood oxygen saturation (SpO2). The present study aimed to examine data on whether long COVID is associated with
increased insulin resistance (IR) in association with neuroimmune and oxidative (NIO)
processes during the acute infectious and long COVID phases.
METHODS: This case-control, retrospective cohort study used the Homeostasis Model Assessment
2 (HOMA2) calculator© to compute ß-cell function (HOMA2%B) and insulin sensitivity (HOMA2%S) and resistance
(HOMA2-IR) and administered the Beck Depression Inventory (BDI) and Hamilton Depression
Rating Scale (HAMD) to 86 patients with long COVID and 39 controls.
RESULTS: Long COVID (3-4 months after the acute infection) is accompanied by increased HOMA2-IR,
fasting blood glucose (FBG), and insulin levels; 33.7% of the patients vs. 0% of the
controls had HOMA2-IR values > 1.8, suggesting IR. Increased IR was predicted by PBT
during acute infection and associated with depressive symptoms above and beyond the
effects of NIO pathways (nucleotide-binding domain, leucine-rich repeat, and pyrin
domain-containing protein 3 [NLRP3] inflammasome, myeloperoxidase [MPO], protein oxidation).
There were no significant associations between increased IR and the activated NIO
pathways during long COVID.
CONCLUSION: Long COVID is associated with new-onset IR, which may contribute to onset of depressive
symptoms due to long COVID by enhancing overall neurotoxicity.
Keywords: Inflammation; oxidative and nitrosative stress; major depression; mood disorders; biomarkers.
FIGURES
| Received: December 12 2022; Accepted: February 3 2023 |
INTRODUCTION
The pathogenesis of acute COVID-19 includes SARS-CoV-2 entry into the host respiratory epithelial cells followed by viral translation and multiplication in the cytoplasm and infection of nearby host cells.1- 4 These processes are accompanied by activation of immune-inflammatory pathways and may result in pneumonia, lung injury, and excessive inflammatory responses, including a cytokine storm that may cause disseminated intravascular coagulation and multisystem failure.1-4 SARS-CoV-2 may activate the nucleotide-binding domain, leucine-rich repeat, and pyrin domain-containing protein 3 (NLRP3) inflammasome with elevations in interleukin (IL)-1ß, IL-18, and caspase 1.1- 5
After remission of the acute phase of COVID-19, many people experience long COVID, which comprises a variety of neuropsychiatric and peripheral symptoms, such as neurocognitive impairments, sleep disturbances, affective symptoms (low mood and anxiety), chronic fatigue, and somatic symptoms like dyspnea, autonomic symptoms, and pain symptoms.6- 15 Within 6 months of the onset of COVID-19 symptoms, over one-third of COVID-19 survivors may suffer from such neuropsychiatric symptoms.16
Recently, we found that both acute and long-term COVID are characterized by increases in: i) fatigue and physiosomatic symptoms such as headache, malaise, and fibromyalgia-like, gastrointestinal, cardiovascular, and autonomous symptoms; ii) anxiety symptoms, including anxious mood, tension, irritability, and fears; and iii) depressive symptoms such as low mood, feelings of guilt, and loss of interest.17- 20 Moreover, in both acute and long-COVID, it was possible to extract a single factor (latent vector) from these diverse neuropsychiatric symptoms, suggesting that acute and long-COVID are characterized by a wide range of neuropsychiatric symptoms that are driven by a single latent characteristic, named the "physio-affective phenome."17- 20 "Physio-affective" indicates that intertwined physical and affective symptoms are part of the phenome of long COVID.
Important predictors of the severity of the physio-affective phenome of acute and long COVID include lowered oxygen saturation (SpO2) and increased peak body temperature (PBT) during the acute phase.20 Both lowered SpO2 and increased PBT are sensitive markers of the intensity of the immune-inflammatory response during acute COVID-19 and predict not only critical disease and death due to COVID-19, but also the physio-affective phenome of both acute and long COVID.20- 22
Moreover, activated immune-inflammatory, oxidative, and nitrosative stress (IO&NS) pathways are significantly associated with the physio-affective symptoms of long COVID.17,18 In different studies, we observed that activation of the NLRP3 inflammasome (as indicated by alterations in IL-1ß, IL18, and caspase 1), increased C-reactive protein (CRP), myeloperoxidase (MPO), malondialdehyde (MDA), protein carbonyls, and advanced protein oxidation products (AOPP) and lowered zinc and glutathione peroxidase (Gpx) are associated with physio-affective symptoms of long COVID.18
People with COVID-19, in particular those with severe infections, exhibit an increased risk and excess burden of incident diabetes.23 For example, glycemic abnormalities were detectable 2 months after recovery from COVID-19.24 Mood disorders, including major depression and anxiety disorders, are not only accompanied by activated IO&NS pathways,25,26 but also by relative insulin resistance (IR) and a significant association between IR assessment results and depressive symptoms.26- 30 The neuro-immune-toxicity theory of mood disorders conceptualizes pathophysiology of mood disorders involving increased neurotoxicity due to multiple neurotoxic IO&NS pathways and neurotoxicity due to IR.25- 27 Importantly, in mood and anxiety disorders, increased damage due to O&NS, as indicated by increased AOPP and MDA levels, is significantly associated with increased IR, suggesting that, in mood disorders, increased O&NS plays a role in the onset of IR.26,27 Furthermore, increased lipid peroxidation, aldehyde production, and chlorinative stress are characteristics of the metabolic syndrome (MetS) and are known to mediate IR and atherogenicity in MetS. Inflammatory pathways and the NLRP3 inflammasome play an important role in pathogenesis of IR, type 2 diabetes mellitus (T2DM), and obesity.31,32 Nevertheless, there are no studies that have examined whether the physio-affective symptoms of long COVID are associated with increased IR and whether the latter is associated with signs of activated IO&NS pathways during the acute infectious and long COVID phases.
Hence, the present study aimed to examine whether: i) long COVID is associated with increased IR; ii) increased IR in long COVID is associated with the physio-affective phenome of long COVID, the inflammatory response of the acute infectious phase (as indicated by increased PBT and lowered SpO2), and activated IO&NS pathways (as indicated by increased CRP, NLRP3, AOPP, and MPO levels); and iii) IR is significantly associated with the physio-affective phenome above and beyond the effects of IO&NS biomarkers.
METHODS
Participants
In the present study, we combined a case-control research methodology with a retrospective cohort study design to assess the impact of acute phase biomarkers on IR parameters in patients with long COVID. The case-control strategy allowed us to analyze differences between controls and long COVID subgroups. During the last 3 months of 2021, we included 86 individuals who had at least two long COVID symptoms and had previously been identified and treated for an acute COVID-19 infection. Patients were identified using the officially published World Health Organization (WHO) criteria for post-COVID (long COVID),33 which include the following: i) a history of proven SARS-CoV-2 infection; ii) symptoms that persisted beyond the acute stage of illness or that manifested during recovery from acute COVID-19 infection, lasted at least 2 months, and were present 3-4 months after the onset of COVID-19; and iii) patients who have at least two symptoms from a list shown in Box S1 (available as online-only supplementary material).
All patients were admitted to one of the official quarantine facilities in the city of Al-Najaf that specialize in treatment of acute COVID-19, including the Hassan Halos Al-Hatmy Hospital for Transmitted Diseases, the Middle Euphrates Center for Cancer, the Imam Sajjad Hospital, the Al-Hakeem General Hospital, and the Al-Zahraa Teaching Hospital for Maternity and Pediatrics. During the acute infectious phase, all patients included showed: i) acute respiratory syndrome and the disease's typical symptoms of fever, breathing problems (e.g., shortness of breath), coughing, and loss of smell and taste; ii) positive reverse transcription real-time polymerase chain reaction (rRT-PCR) findings; and iii) presence of positive SARS-specific IgM antibodies. During long COVID, these patients had negative rRT-PCR results after the acute period. We also included 39 controls who were either staff members or their families or friends and were selected from the same catchment area. All 39 controls had negative rRT-PCR results and showed no clinical signs of an acute infection, such as dry cough, sore throat, shortness of breath, fever, night sweats, or chills. Moreover, they all showed a negative history of COVID-19 infection. Exclusion criteria for controls were a lifetime and current history of psychiatric axis-1 disorders, such as major affective disorders (major depressive disorder or bipolar disorder), dysthymia, generalized anxiety disorder, panic disorder, schizo-affective disorder, schizophrenia, psycho-organic syndrome, substance use disorders - with the exception of tobacco use disorder (TUD) - or chronic fatigue syndrome and fibromyalgia. Nevertheless, to account for the confounding effects of psychological stress due to the COVID-19 pandemic (including the effects of lockdown and social isolation) we allowed that around one-third of the controls would show some distress or adjustment symptoms. Consequently, some controls (one-third) showed Hamilton Depression Rating Scale (HAMD) scores34 between 7 and 12. Patients with long COVID were excluded for a lifetime history of the same disorders as described for controls or a current diagnosis of bipolar disorder, schizo-affective disorder, schizophrenia, psycho-organic syndrome, or substance use disorders (with the exception of TUD). Additionally, we excluded patients and controls who had T2DM or T1DM, systemic (auto)immune diseases like inflammatory bowel disease, psoriasis, scleroderma, rheumatoid arthritis, liver or renal disease, or neurodegenerative and neuroinflammatory disorders, including Parkinson's and Alzheimer's disease, multiple sclerosis, or stroke. Moreover, according to the requirements of the HOMA calculator software, the following patient exclusion criteria were also applied: patients with obvious serious overt diabetes complications, such as heart illnesses, liver diseases, or renal diseases; and patients whose fasting insulin was > 400 pM. Additionally, since metformin may have an impact on insulin sensitivity and IR,35 we did not include individuals who were using metformin.36 Women who were pregnant or nursing were also excluded from the study.
Measurements
Clinical assessments
Three to 4 months after the acute infectious phase of COVID-19 (mean ± SD duration of illness: 14.68±5.33 weeks), a senior psychiatrist used a semi-structured interview to collect sociodemographic and clinical data from controls and patients with long COVID. Depression severity was evaluated using HAMD34 and Beck-Depression Inventory (BDI-II)37 scores. TUD was diagnosed using DSM-5 criteria. We recorded immunizations received by the participants, namely AstraZeneca, Pfizer, or Sinopharm. Body mass index (BMI) was calculated by dividing individuals' body weight in kg by the square of their height in meters.
A well-trained paramedical professional measured SpO2 using an electronic oximeter (Shenzhen Jumper Medical Equipment Co., Ltd., Shenzhen, China) and body temperature with a digital thermometer (sublingual until the beep). The lowest SpO2 and PBT readings recorded during the acute period of illness were extracted from patient records. We created a new indicator based on these two evaluations that represents decreased SpO2 and increased PBT as the z transformation of the latter (z PBT) - z SpO2 (dubbed zPBT-zSpO2).
Biomarker assays
Fasting blood samples were collected in the early morning between 7.30 and 9 a.m., before breakfast. Five mL of venous blood were extracted and transferred to clean simple tubes. Hemolyzed specimens were discarded. After 15 minutes, the blood samples were centrifuged at 3,000 rpm for 5 minutes to separate the serum, which was then transferred to three fresh Eppendorf tubes for testing. Fasting blood glucose (FBG) levels were tested spectrophotometrically using a kit provided by Biolabo® (Maizy, France). Commercial ELISA sandwich kits were used to measure serum insulin (DRG® International Inc., USA). The sensitivity of the insulin assay was 1.76 µIU/mL (12.22 pM) and the cost variance percent (CV%) was 2.6%. The Homeostasis Model Assessment 2 (HOMA2) calculator© (Diabetes Trials Unit, University of Oxford; https://www.dtu.ox.ac.uk/homacalculator/download.php) was used to calculate ß-cell function (HOMA2%B), insulin sensitivity (HOMA2%S), and IR (HOMA2-IR) from the fasting serum insulin and glucose levels. We used 2 HOMA2-IR threshold values to denote IR (HOMA2-IR > 1.8) and MetS (HOMA2-IR > 1.4).38 Furthermore, we computed 2 new z unit-based composite scores, namely, a first reflecting IR as zFBG+zInsulin (zFDG+zINS) and a second reflecting HOMA2%B computed as zINS-zFBG.26 In the current study, zFBG+zINS was significantly correlated with the HOMA2-IR index (r = 0.892, p < 0.001, n=125) and zINS-zFBG with HOMA2%B (r = 0.987, p < 0.001, n=125). We employed the CRP latex slide test (Spinreact®, Barcelona, Spain) to assay CRP serum levels. ELISA kits from Nanjing Pars Biochem Co., Ltd. (Nanjing, China) were used to quantify serum levels of MPO, AOPP, IL-1ß, IL-18, and caspase-1. The intra-assay CV values for all assays were less than 10%. Consequently, we computed different composite scores, namely reflecting: i) oxidative stress toxicity (OSTOX) computed as the sum of z AOPP + z MPO; ii) NLRP3 computed as z IL-1ß + z IL-18 + z caspase 1; iii) inflammation as z IL-1ß + z IL-18 + z caspase + z CRP (labeled: zNLPR3+zCRP)18; and iv) an overall neurotoxicity index as zNLRP3+zCRP+zOSTOX+zIR.
Statistical analysis
Analysis of variance (ANOVA) or the Kruskal-Wallis test (in case of heterogeneity of variance) were used to examine differences in scale variables across groups, whilst analysis of contingency tables (?2-test) was employed to examine the relationships between nominal variables. We generated correlation matrices using Pearson's product-moment correlation coefficients to evaluate relationships between biomarkers and clinical ratings. Using the univariate generalized linear model (GLM) approach, we determined the relationships between diagnosis and biomarkers while adjusting for confounding factors such as TUD, age, sex, and BMI. We derived estimated marginal mean (SE) values produced by the GLM. Multiple regression analysis was used to identify the significant biomarkers that predict physio-affective assessments. We also used an automated stepwise procedure with a p-value of 0.05 to enter and p = 0.06 to remove. We determined the standardized beta coefficients for each significant explanatory variable using t statistics with accurate p-values, model F statistics, and total variance explained (R2). In addition, we investigated the residual plots and checked for multicollinearity utilizing the variance inflation factor (VIF) and tolerance and we tested for heteroskedasticity using the White and modified Breusch-Pagan tests. K means cluster analysis was performed to delineate a subgroup of patients with aberrations in biomarkers and increased depression rating scales. K means factor analysis was used to identify clusters of patients using biomarkers as clustering variables. All statistical analyses were conducted using SPSS version 28 for Windows.
Partial least squares (PLS) analysis39 was used to determine the associations between biomarkers entered as input variables and symptom domain scores entered as output variables. Data were entered as either single indicators (all biomarkers) or as a latent vector generated from the symptom dimensions. PLS path analysis was conducted using 5,000 bootstrap samples only when: i) the overall quality of the model as indicated by standardized root mean squared error (SRMR) < 0.080 was adequate; ii) the latent vectors extracted from indicators had adequate reliability as indicated by average variance extracted (AVE) > 0.500, Cronbach's alpha > 0.7, composite reliability > 0.7, rho_A > 0.80; iii) all indicators loaded strongly (> 0.660) at p < 0.001 on the latent vector; and iv) construct cross-validated redundancies were adequate.39 We employed complete bootstrapping (5,000 subsamples) and PLS path modeling to compute path coefficients with p-values and total and indirect effects.40
Ethics statement
Before participating in the study, all controls and patients or their parents or legal guardians gave written informed consent. The Najaf Health Directorate, Training and the Human Development Center (document no. 18378/2021) and the institutional ethics board at the University of Kufa (8241/2021) both gave their approval for the study. Our institutional review board follows the International Guideline for Human Research Safety and the study was carried out in accordance with Iraqi and international ethical and privacy laws, such as the World Medical Association's Declaration of Helsinki, The Belmont Report, the Council for International Organizations of Medical Sciences (CIOMS) Guideline, and the International Conference on Harmonization of Good Clinical Practice (ICH-GCP).
RESULTS
Sociodemographic data and IR measurements
Table 1 shows the sociodemographic data and IR measurements in healthy controls (HC) and patients with long COVID. There were no significant differences in age, sex, BMI, married status, urban/rural distribution, vaccination status, or smoking between the groups, although educational level was marginally higher in the patient group. The total BDI and HAMD scores were significantly higher in patients than in controls. FBG, insulin, HOMA2-IR, and zFBG+zINS were significantly higher in patients than in controls, whereas HOMA2%S and zINS-zFBG were significantly lower in patients. The incidence of IR (defined as HOMA2-IR > 1.8) and MetS (defined as HOMA2-IR > 1.4) were significantly higher in patients with long COVID than in HC.
| Variable | HC (n=39) | Long COVID (n=86) | F/?2 | df | p-value |
|---|---|---|---|---|---|
| Age (years) | 28.1 (7.6) | 28.4 (6.2) | 0.00 | 1/123 | 0.967 |
| Sex (female/male) | 15/24 | 24/62 | 1.39 | 1 | 0.238 |
| BMI (kg/m2) | 25.60 (3.98) | 26.15 (4.55) | 0.42 | 1/123 | 0.517 |
| Education (years) | 14.95 (1.28) | 15.65 (1.74) | 5.10 | 1/123 | 0.026 |
| Single/married | 17/22 | 37/49 | 0.00 | 1 | 0.953 |
| Urban/rural | 8/31 | 15/71 | 0.17 | 1 | 0.681 |
| Vaccination (A/Pf/S) | 9/21/9 | 20/48/18 | 0.08 | 2 | 0.963 |
| Smoking (no/yes) | 24/15 | 61/25 | 0.03 | 1 | 0.854 |
| BDI-total | 8.5 (3.6) | 24.8 (7.6) | MWU | - | < 0.001 |
| HAMD-total | 5.6 (2.1) | 16.9 (5.0) | MWU | - | < 0.001 |
| FBG (mM┼) | 5.52 (0.12) | 5.89 (0.08) | 6.39 | 1/119 | 0.013 |
| Insulin (pM┼) | 62.38 (4.45) | 86.74 (2.99) | 20.49 | 1/119 | < 0.001 |
| HOMA2%B┼ | 89.42 (3.67) | 96.84 (2.46) | 2.49 | 1/119 | 0.097 |
| HOMA2%S┼ | 86.71 (3.19) | 67.07 (2.14) | 25.86 | 1/119 | < 0.001 |
| HOMA2-IR┼ | 1.19 (0.09) | 1.67 (0.06) | 20.58 | 1/119 | 0.087 |
| IR (HOMA2-IR > 1.8) (no/yes) | 39/0 | 57/29 | 17.12 | 1 | < 0.001 |
| MetS (HOMA2-IR > 1.4) (no/yes) | 34/5 | 41/45 | 17.45 | 1 | < 0.001 |
| zFBG+zINS (z scores)┼ | -0.527 (0.153) | 0.239 (0.103) | 17.09 | 1/119 | < 0.001 |
| zINS-zFBG (z scores)┼ | -0.220 (0.165) | 0.125 (0.111) | 2.98 | 1/119 | 0.087 |
Data presented as mean (SD), unless otherwise specified.
A/Pf/S = vaccination type either AstraZeneca (A), Pfizer-BioNTech (Pf), or Sinopharm (S); BDI = Beck Depression Inventory; BMI = body mass index; df = degrees of freedom; FBG = fasting blood glucose; HAMD = Hamilton Depression Rating Scale, HC = healthy controls; HOMA2%B = beta cell function; HOMA2%S = insulin sensitivity; HOMA2 = Homeostasis Model Assessment 2; HOMA2-IR = insulin resistance index; IR = insulin resistance; MetS = metabolic syndrome; MWU = Mann-Whitney U test; zFBG+zINS (z scores) = composite score reflecting IR; zINS-zFBG = composite score reflecting HOMA2%B.
┼ Estimated marginal mean (SE) values after covarying for age, sex, smoking, and BMI.
Results of cluster analysis
To identify patients with long COVID characterized by disorders in biomarkers and increased depression scale scores, we performed K means factor analysis using OSTOX, zNLRP3+CRP, zFBG+zINS, and zBDI+zHAMD as clustering variables. Two clusters were formed with an adequate silhouette measure of cohesion and separation of 0.6, cluster 1 comprises 64 subjects, and cluster 2 comprises 61 subjects. Only patients with long COVID were allocated to cluster 2, while cluster 1 consists of 25 patients and 39 HC. Table 2 demonstrates the sociodemographic data for cluster 1 and cluster 2 subjects. No significant differences between these study groups were detected in age, BMI, sex, vaccination type, or TUD, whereas subjects in cluster 2 had significantly higher PBT, zPBT-zSpO2, and total BDI and HAMD scores, and lower SpO2-than cluster 1 subjects. FBG and insulin, HOMA-2IR, and the zFBG+zINS score were significantly greater in cluster 2 than in cluster 1, whereas there were no significant differences in HOMA2%B or zINS-zFBG. The HOMA2%S and zINS-zFBG indices were significantly lower in cluster 2 than in cluster 1. Covarying for age, BMI, sex, and TUD showed that none of these variables had any effect on the IR-related data. Table 2 shows that zOSTOX, AOPP, zNLRP3, zNLRP3+ zCRP, CRP, caspase 1, IL-1ß, and IL-18 were significantly higher in cluster 2 than cluster 1 and that only part of the patients (61/86) show aberrations in these pathways.
| Variable | Cluster 1 (n=64) | Cluster 2 (n=61) | F/?2 | df | p-value |
|---|---|---|---|---|---|
| Age (years) | 28.1 (7.2) | 28.59 (6.00) | 0.17 | 1/123 | 0.686 |
| Sex (female/male) | 22/42 | 17/44 | 0.62 | 1 | 0.433 |
| Healthy controls/patients | 39/25 | 0/61 | 54.03 | 1 | < 0.001 |
| BMI (kg/m2) | 25.66 (3.68) | 26.32 (5.01) | 0.70 | 1/123 | 0.404 |
| Vaccination (A/Pf/S) | 14/33/17 | 15/36/10 | 1.91 | 2 | 0.385 |
| Peak body temperature | 37.39 (0.75) | 38.75 (0.96) | 78.29 | 1/123 | < 0.001 |
| Lowest SpO2 (%) | 93.58 (2.62) | 90.85 (4.56) | 16.98 | 1/123 | < 0.001 |
| zPBT_zSpO2 | -0.532 (0.686) | 0.558 (0.977) | 52.57 | 1/123 | < 0.001 |
| BDI-total | 12.8 (7.5) | 26.87 (6.8) | 119.73 | 1/123 | < 0.001 |
| HAMD-total | 8.6 (4.7) | 18.33 (4.8) | 131.02 | 1/123 | < 0.001 |
| FBG (mM) | 5.63 (0.09) | 5.92 (0.10) | 4.68 | 1/120 | 0.032 |
| Insulin (pM) | 70.91 (3.58) | 87.78 (3.67) | 10.77 | 1/120 | 0.001 |
| HOMA2%B | 92.33 (2.87) | 96.82 (2.94) | 1.19 | 1/120 | 0.278 |
| HOMA2%S | 80.28 (2.57) | 65.77 (2.63) | 15.43 | 1/120 | < 0.001 |
| HOMA2 IR | 1.36 (0.07) | 1.69 (0.07) | 10.83 | 1/120 | 0.001 |
| zFBG+zInsulin (z scores) | -0.273 (0.122) | 0.286 (0.125) | 10.19 | 1/120 | 0.002 |
| zINS-zFBG (z scores) | 0.114 (0.133) | -0.075 (0.130) | 1.03 | 1/120 | 0.311 |
| AOPP | 0.148 (0.113) | 1.1432 (0.116) | 4.30 | 1/120 | 0.040 |
| MPO (ng/mL) | 44.46 (2.57) | 51.28 (2.63) | 3.42 | 1/120 | 0.067 |
| zOSTOX (z scores) | -0.229 (0.123) | 0.267 (0.126) | 7.91 | 1/120 | 0.006 |
| CRP | 5.26 (0.43) | 8.36 (0.44) | 29.59 | 1/120 | < 0.001 |
| Caspase 1 (pg/mL) | 69.10 (2.56) | 81.98 (2.62) | 12.30 | 1/120 | < 0.001 |
| IL-1ß (pg/mL) | 4.40 (0.25) | 5.92 (0.25) | 18.37 | 1/120 | < 0.001 |
| IL-18 (pg/mL) | 219.59 (9.22) | 257.75 (9.45) | 8.30 | 1/120 | 0.005 |
| zNLRP3 (z scores) | -0.496 (0.109) | 0.463 (0.112) | 37.40 | 1/120 | < 0.001 |
| zNLRP3+zCRP (z scores) | -0.641 (0.096) | 0.673 (0.098) | 91.01 | 1/120 | < 0.001 |
| zNeurotoxicity (z scores) | -1.958 (0.266) | 1.999 (0.272) | 107.71 | 1/119 | < 0.001 |
Data presented as mean (SD), unless otherwise specified.
A/Pf/S = vaccination type either AstraZeneca (A), Pfizer-BioNTech (Pf), or Sinopharm (S); AOPP = advanced oxidation protein products; BDI = Beck Depression Inventory; BMI = body mass index; CRP = C-reactive protein; df = degrees of freedom; FBG = fasting blood glucose; HAMD = Hamilton Depression Rating Scale; HOMA2 = Homeostasis Model Assessment 2; HOMA2%B = beta cell function; HOMA2%S = insulin sensitivity; HOMA2-IR = insulin resistance index; IR = insulin resistance; IL = interleukin; MetS = metabolic syndrome; MPO = myeloperoxidase; NLRP3 = inflammasome computed as zIL-1ß+zIL-18+zcaspase1; SpO2 = oxygen saturation; zFBG+zINS = composite score reflecting IR; zINS-zFBG = composite score reflecting HOMA2%B; zNeurotoxicity = a composite score based on zIR+zNLRP3+zCRP+ zOSTOX; zOSTOX = composite score of oxidative stress.
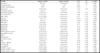
Table 3 shows the intercorrelation matrix between zFBG+zINS and zINS-zFBG and other clinical data and biomarkers. zFBG+zINS was significantly correlated with zBDI+zHAMD, total BDI, total HAMD, and PBT. There were no significant correlations between zFBG+zINS and zINS-zFBG, zNLRP3+zCRP, zOSTOX, or SpO2. There were no significant correlations between zINS-zFBG and any of the other variables.
| Variables | zFBG+zINS | zINS-zFBG |
|---|---|---|
| zFBG+zINS | 1 | 0.007 (0.941) |
| zINS-zFBG | 0.007 (0.941) | 1 |
| BDI-total | 0.284 (0.001) | 0.003 (0.973) |
| HAMD-total | 0.262 (0.003) | -0.025 (0.779) |
| zBDI+zHAMD | 0.283 (0.001) | -0.012 (0.898) |
| zNLRP3+zCRP | 0.092 (0.308) | 0.018 (0.844) |
| zOSTOX | 0.058 (0.522) | 0.082 (0.365) |
| PBT | 0.267 (0.003) | 0.087 (0.334) |
| SpO2 | -0.040 (0.660) | -0.140 (0.119) |
Data presented as correlation coefficient r (p-value), unless otherwise specified.
Bold type denotes a significant correlation (p < 0.05).
BDI = Beck Depression Inventory; FBG = fasting blood glucose; HAMD = Hamilton Depression Rating Scale; HOMA2%B = beta cell function; INS = insulin; IR = insulin resistance; PBT = peak body temperature; SpO2 = oxygen saturation; zBDI+zHAMD = index of depression severity; zFBG+zINS = composite score reflecting insulin resistance; zINS-zFBG = composite score reflecting HOMA2%B; zNLRP3+zCRP = integrated inflammasome and C-reactive protein (CRP) index; zOSTOX = composite score of oxidative stress biomarkers.

Prediction of the scores of depression scales using biomarkers
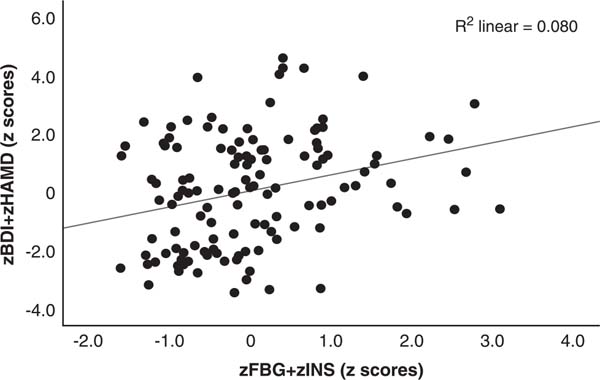
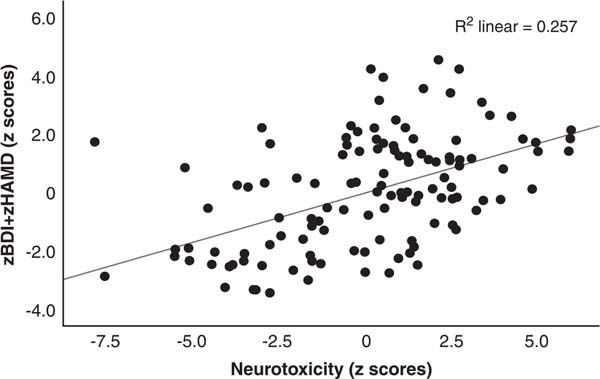
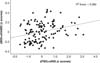
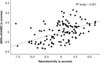
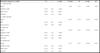
Table 4 shows the results of the multiple regression analysis with the total HAMD and BDI scores as dependent variables and the measured biomarker composite scores as explanatory variables while allowing for the effects of age, sex, education, TUD, and BMI. Regression #1 shows that zNLRP3+CRP, zFBG+zINS, and zOSTOX (all three significantly and positively associated) explained 26.4% of the variance in the zBDI+zHAMD score. Figure 1 shows the partial regression plot of zBDI+zHAMD on zFBG+zINS after adjusting for the variables listed in Table 4. In regression #2, 56.8% of the variance in the zBDI+zHAMD score could be explained by PBT and zNeurotoxicity. Figure 2 shows the partial regression plot of zBDI+zHAMD on zNeurotoxicity. We found that 24.8% of the variance in the total BDI score could be explained by the regression on zNLRP3+CRP, zFBG+zINS, and zOSTOX (regression #3). Regression #4 shows that 24.7% of the variance in the total HAMD score could be explained by the regression on the zNLRP3+CRP, zFBG+zInsulin, and zOSTOX.
| Dependent/explanatory variable | ? | t | p-value | F model | df | p-value | R2 |
|---|---|---|---|---|---|---|---|
| #1. zBDI+zHAMD | |||||||
| Model | 14.48 | 3/121 | < 0.001 | 0.264 | |||
| zNLRP3+zCRP | 0.348 | 4.42 | < 0.001 | ||||
| zFBG+zINS | 0.238 | 3.04 | 0.003 | ||||
| zOSTOX | 0.218 | 2.78 | 0.006 | ||||
| #2. zBDI+zHAMD | |||||||
| Model | 80.26 | 2/122 | < 0.001 | 0.568 | |||
| PBT | 0.632 | 9.33 | < 0.001 | ||||
| zNeurotoxicity | 0.207 | 3.06 | 0.003 | ||||
| #3. BDI-total | |||||||
| Model | 13.287 | 3/121 | < 0.001 | 0.248 | |||
| zNLRP3+zCRP | 0.307 | 3.85 | < 0.001 | ||||
| zFBG+zInsulin | 0.242 | 3.05 | 0.003 | ||||
| zOSTOX | 0.242 | 3.04 | 0.003 | ||||
| #4. HAMD-total | |||||||
| Model | 13.21 | 3/151 | < 0.001 | 0.247 | |||
| zNLRP3+zCRP | 0.365 | 4.58 | < 0.001 | ||||
| zFBG+zINS | 0.218 | 2.75 | 0.007 | ||||
| zOSTOX | 0.179 | 2.25 | 0.026 |
BDI = Beck Depression Inventory; df = degrees of freedom; FBG = fasting blood glucose; HAMD = Hamilton Depression Rating Scale; INS = insulin; PBT = peak body temperature; SpO2 = peripheral oxygen saturation; zBDI+zHAMD = composite score comprising BDI and HAMD; zFBG-zINS = index of insulin resistance; zNLRP3+zCRP = composite score comprising the NLRP3 inflammasome and C-reactive protein (CRP); zOSTOX = composite of oxidative stress biomarkers.
Results of PLS path and PLS predict analysis
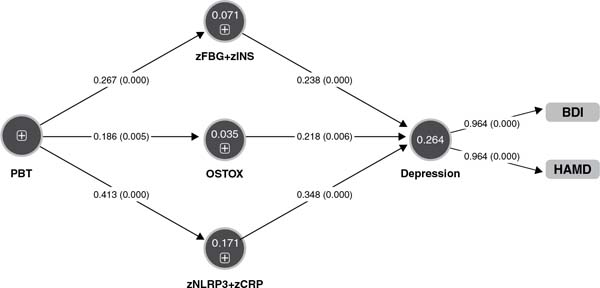
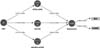
Figure 3 shows the final PLS model obtained after feature selection, prediction-oriented segmentation with multi-group analysis, and PLS prediction analysis. For example, the type of vaccination was not included in the final model because the effects were not significant. The model shows adequate quality of fit data, including an SRMR of 0.013. We found that 26.4% of the variance in depression severity (a factor extracted from the total HAMD and BDI scores) was explained by zFBG+zINS, OSTOX, and zNLRP+CRP. Increased PBT explained part of the variance in zFBG+zINS (7.1%), OSTOX (3.5%), and zNLRP+CRP (17.1%). PBT had a significant indirect effect on depression severity (t = 4.49, p < 0.001), which was mediated by zFBG+zINS (t = 2.13, p = 0.034) and zNLRP3+zCRP (t = 2.86, p = 0.004).
DISCUSSION
Differences in IR parameters between long-COVID and controls
The first major finding of the present study is that long COVID is characterized by increased HOMA2-IR, FBG, and insulin and by lowered HOMA2%S. Moreover, using threshold values of HOMA2-IR to denote IR (HOMA2-IR > 1.8) and MetS (HOMA2-IR > 1.4),38 we found that 33.7% of the patients fulfilled the criteria for IR (vs. 0% of the controls) and 52.3% for MetS (vs. 12.8% of the normal controls). There was a significant effect of PBT during acute infection (an indicant of severity of illness) on IR during long COVID, but the effect size was very small. It is known that patients with T1DM or T2DM are more vulnerable to SARS-CoV-2 and have increased risk of critical disease and mortality due to COVID-19.1,41 Moreover, COVID-19 may increase glucose levels, aggravate IR, and cause new-onset IR and chronic metabolic disorders that did not exist before the COVID-19 infection.41- 43 Our results showing an increased HOMA2-IR index and increased IR in patients with long COVID extend previous results showing that the prevalence rate of IR ranged between 8.2 and 15% in hospitalized Chinese children and adults infected with SARS-CoV-2,44,45 whilst higher prevalence rates (34.6%) were observed in patients with COVID-19 with the more severe and critical form of the disease.45
Biomarkers of increased IR in long COVID
The second major finding of this study is that IR due to long COVID is predicted by increased PBT during the acute phase of infection. Contrary to the a priori hypothesis, IR was not significantly associated with lowered SpO2 during the acute phase or with key IO&NS biomarkers of long COVID, such as increased CRP, NLRP3 activation, and oxidative pathways (including MPO and AOPP levels). The results of our PLS analysis show that the severity of the inflammatory response during the acute infectious phase is associated with increases in IR (small effect size of 7.1%), inflammatory responses (medium effect size of 17.1%), and oxidative toxicity (small effect size of 3.5%) during long COVID.
The effects of the immune-inflammatory response during the acute phase of new-onset IR may be explained by the knowledge that SARS-CoV-2 may cause an (excessive) immune response with release of a wide spectrum of cytokines generating a systemic proinflammatory milieu with increased levels of IL-6 and tumor necrosis factor (TNF)-a, which are known to contribute to IR, ß-cell hyperstimulation, and, ultimately, ß-cell death.41,43,46- 49 In addition, low-grade inflammation, as may be observed in long COVID,17 is known to contribute to development of IR and the progression to T2DM,50,51 for example, through increases in gluconeogenic stress hormones and the resulting increased demand for ß-cells.52
Our negative findings that lowered SpO2 and increased MPO levels have no discernible effect on the HOMA2-IR index contrast with the knowledge that intermittent hypoxia can lead to increased ß-cell proliferation and death due to oxidative stress.53 The pancreatic ß-cell is metabolically very active and highly dependent on oxygen supply,54 whereas ß-cells have relatively low antioxidant levels and are, therefore, very sensitive to oxidative stress.55- 57 In addition, hypoxia, followed by reoxygenation, elicits oxidative stress.58 Our negative findings that increased O&NS, including MPO levels, have no significant impact on the HOMA2-IR index contrast with the knowledge that COVID-19-associated elevations in MPO are associated with the HOMA2-IR index.42 Moreover, treatment with MPO may upregulate gluconeogenesis, TNF-a, and IL-6 gene expression in adipocytes and human umbilical vein endothelial cells (HUVEC), resulting in increased IR.42 Although increased reactive oxygen species impact insulin receptor signaling, thereby, contributing to IR,59 we could not detect any effects of O&NS on IR in long COVID.
All in all, inflammation during the acute phase has only a small effect on new-onset IR, while activated IO&NS pathways during long COVID appear to have no effect at all. This indicates that other factors related to the SARS-CoV-2 virus or COVID-19 are largely involved in new-onset IR. In this respect, evidence suggests that SARS-CoV-2 can infect and replicate in insulin-producing pancreatic ß-cells, thereby resulting in impaired production and secretion of insulin and the metabolic dysregulation observed in patients with COVID-19.60- 63 Transcriptome analysis of infected pancreatic cell cultures confirmed that SARS-CoV-2 hijacks the ribosomal machinery in these cells.64 Microvascular damage caused by SARS-CoV-2 or via micro-thrombotic lesions may result in perfusion anomalies in pancreatic islets, which are required for glucose sensing and insulin release, whilst abnormal capillary architecture and fragmentation contribute to ß-cell failure in T1DM and T2DM.65,66 As such, SARS-CoV-2 infection may cause direct pancreatic injury, which may worsen existing IR in T1DM/T2DM or contribute to new-onset IR and T2DM.67,68
Mechanistic explanations associated with COVID-19 are: i) COVID-19 is accompanied by a hypercoagulable state69,70 which may cause endothelial injuries leading to microvascular inflammation and thrombosis71; ii) autonomic dysfunction or autoimmunity60,61; and iii) secondary mitochondrial dysfunctions.72
IR and depression in long COVID
The third major finding of this study is that the increased depression scores during long COVID are significantly related to IR and that the latter impacts depression above and beyond the effects of inflammation, NLRP3, and O&NS activation. Previously, we have reviewed that there is a link between major depression and increased IR, T1DM/T2DM, and obesity.26,27,30 Apart from IO&NS processes, other mechanisms may explain this relationship, including changes in the endocannabinoid system, mitochondrial dysfunctions, the gut microbiome, and the endogenous opioid system.30
Our results suggest that IR in long COVID may contribute to the overall neurotoxicity, which comprises effects of IO&NS mechanisms.25,73 Recently, we have described the mechanism that may explain these IR-associated neurotoxic effects on the physio-affective phenomenon of MDD.74 For example, IR is associated with decreases in metabolic activity in the medial prefrontal cortex and in hippocampal volume, dysfunctions in the medial prefrontal cortex and hippocampal connectome, and neurocognitive impairments including in executive functions and memory.75- 77 Increased IR in the central nervous system is associated with lower levels of brain-derived neurotrophic factor, impaired synaptic plasticity, fewer dendritic spines, and neurodegeneration.78,79 Furthermore, the endothelial dysfunctions caused by IR may result in blood-brain barrier breakdown, which in turn may lead to elevated translocation of proinflammatory compounds from the plasma compartment to the CNS, thereby contributing to neuronal abnormalities, neuroinflammation, and neurodegeneration.80,81
The results of this study would have been more informative if we had measured atherogenicity biomarkers, gluconeogenic stress, MetS-related peptide hormones including adiponectin, leptin, ghrelin and somatostatin, and mitochondrial functions.
The results show that long COVID is associated with increased IR and new onset IR (based on a HOMA2-IR INDEX > 1.8) and that the increased IR is only mildly associated with signs of the inflammatory response during the acute phase and is not associated with the mild IO&NS processes during long COVID. IR due to long COVID is associated with depressive symptoms that are present in long COVID and increased IR may contribute to the neurotoxicity pathophysiology of depression together with IO&NS pathways. Future research should examine other possible mechanisms leading to IR in long COVID including hypercoagulation, endothelial injuries, microvascular inflammation, thrombosis, and mitochondrial functions during acute COVID-19 infection, and the onset of autoimmune responses in long COVID. One possibility could be to evaluate treatments with metformin, which may be useful to treat depression82 and improve the outcome of patients with COVID-19 and pre-existing T2DM.83,84
ACKNOWLEDGEMENTS
We appreciate the assistance of the workers at Al-Sadr Teaching Hospital and Al-Amal Specialized Hospital for Communicable Diseases in the Najaf governorate of Iraq. We would also like to thank the highly-skilled employees at the hospital's internal laboratories for their assistance in determining biomarker levels.
 PDF
 Print
 Send this article by email
 How to cite this article
 Submit a comment
 Mendeley
 Pocket
 Share on Facebook
 Share on Twitter