



ABSTRACT:
OBJECTIVE: Cerebrospinal fluid (CSF) biomarkers add accuracy to the diagnostic workup of cognitive
impairment by illustrating Alzheimer's disease (AD) pathology. However, there are
no universally accepted cutoff values for the interpretation of AD biomarkers. The
aim of this study is to determine the viability of a decision-tree method to analyse
CSF biomarkers of AD as a support for clinical diagnosis.
METHODS: A decision-tree method (automated classification analysis) was applied to concentrations
of AD biomarkers in CSF as a support for clinical diagnosis in older adults with or
without cognitive impairment in a Brazilian cohort. In brief, 272 older adults (68
with AD, 122 with mild cognitive impairment [MCI], and 82 healthy controls) were assessed
for CSF concentrations of Aß1-42, total-tau, and phosphorylated-tau using multiplexed Luminex assays; biomarker values
were used to generate decision-tree algorithms (classification and regression tree)
in the R statistical software environment.
RESULTS: The best decision tree model had an accuracy of 74.65% to differentiate the three
groups. Cluster analysis supported the combination of CSF biomarkers to differentiate
AD and MCI vs. controls, suggesting the best cutoff values for each clinical condition.
CONCLUSION: Automated analyses of AD biomarkers provide valuable information to support the clinical
diagnosis of MCI and AD in research settings.
Keywords: Alzheimer's disease; mild cognitive impairment; diagnosis; cerebrospinal fluid; machine learning; decision tree.
FIGURES
| Received: June 19 2021; Accepted: November 29 2021 |
INTRODUCTION
Alzheimer's disease (AD) is a progressive neurodegenerative disease and the most prevalent form of dementia affecting the aging population worldwide.1,2
The natural history of AD according to core neuropsychological changes is relatively well established even at pre-dementia stages,3-7 with amnestic deficits being followed by executive dysfunction and, ultimately, functional impairment.8,9 The pathogenesis of AD comprises overproduction of the amyloid-beta (Aß) peptide and its accumulation in the brain decades before the onset of clinical symptoms.10-12 These pathological changes are accompanied by the hyperphosphorylation of microtubule-associated protein tau, leading to its aggregation into paired helical filaments and subsequent collapse of the neuronal cytoskeleton.13
Reduced cerebrospinal fluid (CSF) concentrations of Aß1-42 and elevated levels of total tau protein (t-tau) and 181Thr-phosphorylated-tau protein (p-tau) have been consistently defined as core CSF biomarkers representative of AD pathology - the so-called "AD signature" in the CSF.14 This knowledge subsidized the development of diagnostic biomarkers and pharmaceutical compounds to pursue disease modification. It also allowed the ante mortem characterization of AD pathology, supporting a new diagnostic framework of the disease based on biomarkers. Since the amyloid, tau, neurodegeneration research framework proposed in 2018 establishes that AD is a complex neurodegenerative disorder that is better accounted for by a biological construct rather than a purely clinical syndrome, the validation of biochemical analysis of biomarkers has become essential, as has the combined analysis of these biomarkers with structural, functional, and/or molecular neuroimaging.
Challenges in CSF biomarkers analysis includes variability in measured values due to pre-analytical, analytical, and post-analytical factors, as well as the lack of consensus on cutoff values.15,16 The sources of pre-analytical bias are generally related to CSF collection and lumbar puncture techniques; analytical bias is mostly associated with the testing platform and analytical supplies; finally, post-analytical bias emerges when statistical methods and composition of patient samples usually determine different, not universally accepted, cutoff scores for the diagnostic classification of AD using CSF biomarkers. This challenge reinforces the importance that each laboratory ensure stability in its measurements and use internally qualified cutoff levels, and that laboratory procedures and the performance of diagnostic kits be improved.17,18
Machine learning (ML) techniques offer automated, naïve classification methods to yield clinical predictions with good diagnostic accuracy.19-21 These methods have been used for classification purposes or for regression, determining a numeric value.22 In the present study, we assess the performance of a decision-tree method in the classification of three clinical groups (mild cognitive impairment [MCI], AD, and healthy controls [HC]) according to their pattern of CSF biomarkers, seeking to determine the validity of the method as a support for clinical diagnosis in research settings. We hypothesize that automatic methods may represent an alternative approach to incorporate biomarkers into the diagnostic workup of cognitive impairment in older adults.
METHODS
Sample and clinical assessments
Participants were recruited from a cohort of older adults who are regularly followed up at a university-based psychogeriatric clinic in São Paulo, Brazil (Instituto de Psiquiatria, Hospital das Clínicas, Faculdade de Medicina, Universidade de São Paulo [HCFMUSP]). This outpatient clinic receives referrals of patients with suspected cognitive decline from the primary care sector and from other divisions of this tertiary hospital. The cohort also includes community-dwelling elders who spontaneously sought medical attention due to cognitive complaints or worries about developing dementia (for instance, relatives or acquaintances of patients under treatment for cognitive disorders in our clinic). All participants were interviewed and evaluated by a multidisciplinary team of psychiatrists, neurologists, geriatricians, neuropsychologists, speech pathologists, and occupational therapists.
Clinical history and medical, neurological, and psychiatric examinations were obtained from all participants. Cognitive diagnoses were established with the aid of a comprehensive neuropsychological and functional assessment that included the Fuld Object Memory Evaluation,23 the Rivermead Behavioral Memory Test,24,25 tasks A and B of the Trail Making Test,26 the Revised Wechsler Adult Intelligence Scale Vocabulary and Block Design subtests,27 and the Informant Questionnaire on Cognitive Decline in the Elderly.28 The Mini-Mental State Examination29 was also administered. All participants were screened for treatable causes of dementia (complete blood count, liver enzymes, serum vitamin B12, human immunodeficiency virus serology, Venereal Disease Research Laboratory test for syphilis, and kidney and thyroid function), as well as by structural magnetic resonance imaging. Exclusion criteria for all participants were: a) history of or current neurological and/or psychiatric comorbidities (including major depression) which might lead to inaccurate cognitive assessment; b) uncompensated systemic diseases; and c) recent introduction or dose adjustment of medications that could interfere with cognitive performance. All subjects were diagnosed based on clinical assessment, taking into account cognitive screening and neuropsychological test scores in addition to routine laboratory and imaging tests; CSF biomarkers were not used for initial diagnosis. Thus, the multidisciplinary team was blind to the results of CSF biomarker analysis at the time of clinical diagnosis.
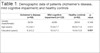
All included participants were assessed consecutively from 2017 to 2019. After the selection process, 272 participants were divided into three diagnostic groups: 122 participants were clinically diagnosed with MCI using Petersen criteria,7 68 with AD according to the National Institute on Aging-Alzheimer's Association criteria,30,31 and 82 individuals displayed no evidence of cognitive impairment nor of any psychiatric disorders at the time of evaluation, being, therefore, defined as HC. Table 1 displays demographic data (age, gender, and education level) of participants across diagnostic groups.
| Alzheimer's disease (n=68) | Mild cognitive impairment (n=122) | Healthy controls (n=82) | p-value | |
|---|---|---|---|---|
| Gender (male/female) | 30/38 | 42/80 | 28/54 | 0.348 |
| Age (years) | 73.2±8.1 | 72.8±7.7 | 69.8±11.8 | 0.051 |
| Education (years) | 9.3±5.2 | 10.5±7.3 | 14.9±13.8 | 0.001 |
Data presented as mean ± standard deviation.
Bold type denotes significant p-value by Kruskal-Wallis plus post-hoc Dunn-Bonferroni's test. The difference is in healthy controls vs. Alzheimer's disease and healthy controls vs. mild cognitive impairment groups.
Cerebrospinal fluid biomarkers
To minimize sources of pre-analytical bias, we followed the protocol recommended by the Alzheimer's Association Quality Control Group for AD-related biomarker studies for collection and storage of CSF samples.17 All participants underwent lumbar puncture directed at the L3/L4 or L4/L5 intervertebral spaces, using a 23-gauge needle. CSF samples were obtained in the morning; no fasting was required. Aliquots containing 12-15 mL of CSF each were collected into polypropylene tubes, centrifuged at 3,200 g for 10 minutes at 4 °C, split into 0.5-mL aliquots in cryotubes, and immediately frozen and stored at -80 °C until analysis. No samples were thawed and refrozen.
Concentrations of Aß1-42, t-tau, and p-tau were determined in duplicate following manufacturer instructions, using two multiplexed kits: i) INNO-BIAT AlzBio3 (Fujirebio, Malvern, USA), using polystyrene microspheres; and ii) MilliplexT MAP Human Amyloid Beta and tau Panel (EMD Millipore Corporation, Billerica, USA), using magnetic microspheres, and yielding determinations of Aß1-40 in addition to the former three biomarkers. Both assays were performed in a Luminex 200 platform (Luminex, Austin, USA). Standard curves were constructed for each biomarker by a sigmoidal curve-fitting method, and the mean fluorescence values for duplicate CSF samples were used to determine the concentration of Aß1-42, t-tau, and p-tau in pg/mL. Since the discontinuation of the INNO-BIAT AlzBio3 test, we started using MilliplexT MAP diagnostic kits. Although similar, the latter have greater sensitivity, which required redefinition of internal reference values in our samples.
Statistical analysis
Statistical analysis of demographic and clinical characteristics was performed in SPSS version 22, at a significance level of p = 0.05 (a = 95%). We used Pearson's chi-square test for categorical variables, and analysis-of-variance methods (Kruskal-Wallis plus post-hoc Dunn-Bonferroni's test) for continuous variables. Analyses of covariance followed by Sidák test were used to assess the influence of age on outcome variables.
A classification and regression tree (CART)32 was used for the analysis of AD-related biomarkers and automatic classification of diagnostic groups according to these values. A decision tree was the selected method because of its low computational complexity and suitability for data sets with relatively small numbers of features. CART is a nonparametric decision-tree method that is suitable for the segmentation of test groups into meaningful subgroups, according to certain variables of interest that may encompass a predictive value. However, unlike logistic and linear regression models, CART does not subsume a prediction equation. Instead, variable data (i.e., CSF biomarkers) are partitioned along the predictor axes into subsets with homogeneous values of the dependent variable (i.e., diagnostic groups), represented by a binary decision tree.33 CART models were constructed using the R program (www.r-project.org/).
As with all correlation statistics, the kappa is a standardized value and thus is interpreted as follows: values = 0 indicate no agreement; 0.01-0.20, none to slight; 0.21-0.40. fair; 0.41-0.60, moderate; 0.61-0.80, substantial; and 0.81-1.00, almost perfect agreement.34 To build these models, we used a variation of a cross-validation test. The sample is divided into parts of the same size (in this case, 10 parts), each of these partitions is removed once, and a model is built with the other nine parts. The quality of the model is measured on the removed partitions and the process is repeated 10 times. We considered a tolerance of 0.01 for independent blinded cross-validation, and the final model was the one with the least cross-validation error, respecting the rule of one standard error.
Ethics statement
The study was approved by the institutional ethics committee at HCFMUSP (Comissão de Ética para Análise de Projetos de Pesquisa [CAPPesq]), process number CAAE 66092117.0.1001.0068, and conducted in accordance with the Declaration of Helsinki. All subjects or their legal guardians provided written consent prior to enrollment in the study and assignment to the distinct interventions that compose the assessment protocol.
RESULTS
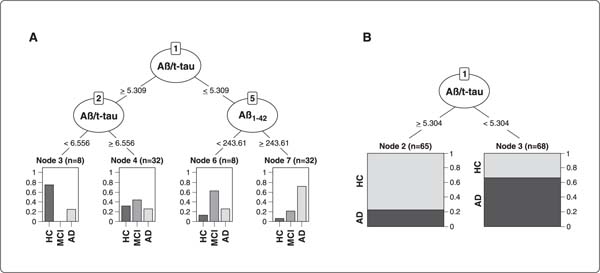
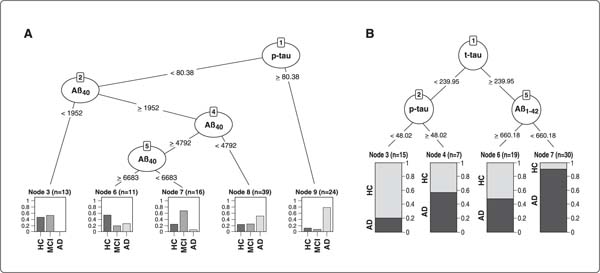
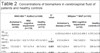
Considering the difference in age between patients and controls, we verified by analysis of covariance (ANCOVA) that there was no influence of these on the outcome variables. Table 2 displays the concentrations of biomarkers in the CSF of patients and HC. Overall, 248 participants (115 with MCI, 60 with AD, and 73 HC) had biomarker data analyzed by the INNO-BIAT AlzBio3 assay, and 103 (32 with MCI, 43 with AD, and 28 HC) by the MilliplexT MAP assay. Figure 1A displays data for MCI, AD, and HC (103 participants), and Figure 1B, for AD and HC (80 participants) using the latter diagnostic assay.
| INNO-BIAT AlzBio3 (n=248) | p-value | MilliplexT MAP (n=103) | p-value | |||||
|---|---|---|---|---|---|---|---|---|
| Alzheimer's disease (n=60) | Mild cognitive impairment (n=115) | Healthy controls (n=73) | Alzheimer's disease (n=43) | Mild cognitive impairment (n=32) | Healthy controls (n=28) | |||
| Aß1-40 (pg/mL) | - | - | - | - | 4,350.6±2,450.4 | 4,223.2±2,499.3 | 4,763.3±2,990.6 | 0.890 |
| Aß1-42 (pg/mL) | 363.4±124.1 | 432.7±170.8 | 475.5±165.5 | < 0.001 | 612.0±584.9 | 749.7±622.0 | 794.9±745.5 | 0.594 |
| t-tau (pg/mL) | 133.2±82.1 | 107.3±74.4 | 89.7±54.2 | 0.001 | 420.7±224.4 | 306.5±171.9 | 286.8±146.6 | 0.003 |
| p-tau (pg/mL) | 68.8±42.3 | 50.4±30.9 | 46.6±28.5 | 0.001 | 81.1±43.8 | 47.6±37.8 | 53.3±42.6 | < 0.001 |
| Aß1-42/t-tau | 4.0±3.7 | 6.0±4.1 | 6.9±3.5 | < 0.001 | 1.6±1.3 | 2.6±2.0 | 3.1±2.9 | 0.003 |
| Aß1-42/p-tau | 7.6±6.0 | 12.4±8.6 | 14.1±8.5 | < 0.001 | 12.6±18.0 | 23.0±28.5 | 21.9±27.2 | 0.003 |
Data presented as mean ± standard deviation.
Bold type denotes a significant p-value by Kruskal-Wallis plus post-hoc Dunn-Bonferroni's test. The difference is in all groups for total tau protein (t-tau) in both methods, healthy controls vs. Alzheimer's disease for amyloid-beta peptide 1-42 (Aß1-42) for INNO-BIAT AlzBio3, 181Thr-phosphorylated tau protein (p-tau) and Aß1-42/t-tau in both methods. For Aß1-42/p-tau, the difference is in healthy controls vs. Alzheimer's disease for INNO-BIAT AlzBio3 and mild cognitive impairment vs. Alzheimer's disease for MilliplexT MAP.
CART models using the INNO-BIAT AlzBio3 assay
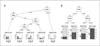
The combination of two CSF biomarker values (Aß1-42/t-tau ratio and concentration of Aß1-42) was able to discriminate MCI, AD, and HC with 60% accuracy (Cohen's kappa coefficient = 0.38; weighted kappa = 0.48). These coefficients indicate that our model had reasonable agreement between observed and predicted data. In node 3 (Figure 1A), the Aß1-42/t-tau ratio lower than 6,556 pg/mL characterized HC with a predictive value of 75%. The Aß1-42/t-tau ratio lower than 5,309 pg/mL with levels of Aß1-42 higher than 243.61 pg/mL characterized patients with AD (node 7) (Figure 1A) with a predictive value of 71.9%.
The classification of subjects as MCI occurred via two branches of the decision tree: if Aß1-42/t-tau ratio < 5,309 pg/mL and Aß1-42 < 243.61 pg/mL (node 6) (Figure 1A) or when the Aß1-42/t-tau ratio = 6.556 pg/mL (node 4) (Figure 1A), with a predictive value of 47.5%. In an attempt to remove confounding factors and improve the resulting model, we removed the MCI group and repeated the analyses (Figure 1B). This procedure increased the accuracy of the model to 71.43% (Cohen's kappa coefficient = 0.43). This model takes into account only Aß1-42/t-tau ratio, i.e., values lower than 5,304 pg/mL characterize patients with AD and a ratio of = 5.304 pg/mL classifies HC with predictive values of 66.2 and 76.9%, respectively.
CART models using the MilliplexT MAP assay
Using the data obtained with the MilliplexT MAP Human Amyloid Beta and tau Panel, we also created a model with two CSF biomarker values (concentrations of Aß1-40 and p-tau) with an accuracy of 61.17%, Cohen's kappa coefficient = 0.38, and weighted kappa = 0.35 (Figure 2A). The best classification of AD was observed at node 9, with p-tau values = 80.86 pg/mL and a predictive value of 61.9%. Levels of p-tau < 80.38 pg/mL and Aß1-40 = 6,683 pg/mL differentiated HC from the other groups with a predictive value of 54.5%. In nodes 3 and 7 (Figure 2A), the combination of biomarkers (p-tau < 80.38 pg/mL and Aß1-40 < 1,952 pg/mL or p-tau < 80.38 pg/mL, and Aß1-40 among 4,792 pg/mL and 5,683 pg/mL) identified MCI subjects with a predictive value of 62%. These data also showed us that the MCI group was a confounding factor, and a significant increase in the coefficients of agreement was found upon exclusion of this group from the analysis (accuracy of 74.65%; Cohen's kappa coefficient = 0.49).
The final model contains three CSF biomarker values (concentrations of t-tau, p-tau and Aß1-42). Levels of t/tau = 239.95 pg/mL and Aß1-42 < 660.18 pg/mL (node 7) (Figure 2B) characterize patients with AD with a predictive value of 83.3%. On the other hand, t-tau < 239.95 pg/mL and p-tau < 48.02 pg/mL (node 3) (Figure 2B) characterize HC with a predictive value of 64.7%. Although the decision tree is intuitive, Table 3 exhibits an overview of the above-described cutoff values in order to simplify data visualization and facilitate clinical applicability.
| MilliplexT MAP(pg/mL) | |
|---|---|
| Alzheimer's disease | t-tau = 239.95 and Aß1-42 < 660.18 |
| Healthy controls | t-tau < 239.95 and p-tau < 48.02 |
Aß = amyloid-beta peptide; p-tau = 181Thr-phosphorylated tau protein; t-tau = total tau protein.

DISCUSSION
In this study, we present the results of a decision-tree method applied to two Luminex-based multiplexed diagnostic kits used in the analysis of AD-related CSF biomarkers. To our knowledge, this is the first study to use decision trees for subject classification using CSF biomarkers in a Brazilian cohort, and the first in Latin America to use this method in this context. In addition, the use of automated techniques to improve the accuracy of clinical diagnosis of AD is a growing field of interest, although the body of supporting evidence is still scarce. The main finding in the characterization of patients with AD was the fact that we achieved reliable predictive profiles with both kits. For the INNO-BIAT AlzBio3 kit, we attained a predictive value of 71.9% by using the Aß1-42/t-tau ratio combined with the concentration of Aß1-42; as for the MilliplexT MAP kit, the predictive rate was 83.3% when employing the combined concentrations of t-tau and Aß1-42. These findings are partially in agreement with similar studies showing an improvement in performance of diagnostic tests using AD biomarkers when comparing decision trees to other forms of definition of cutoff values.35-38 The decision tree performed better with the MilliplexT MAP kit compared to the INNO-BIAT AlzBio3 kit. Another study conducted by our group, in which we used regression models to obtain cutoff values for each of the clinical conditions, showed that the Aß1-42/p-tau ratio exhibits good sensitivity and specificity values to discriminate patients with AD from HC.12 This index was conceived to improve the diagnostic power of CSF biomarkers.39,40 Although the predictive value of the Aß1-42/p-tau ratio was higher in our previous study, the present results support the applicability of automatic classification methods to the diagnosis of AD based on CSF biomarkers.
It is unlikely that a single biomarker will yield an adequate discrimination of cases and non-cases in such a complex disorder as AD,41-43 and to date no specific biomarker has been shown to reliably predict the emergence of clinical symptoms in asymptomatic or oligosymptomatic individuals.44 The use of a combination of biomarkers and their ratios (such as Aß1-42/p-tau of Aß1-42/t-tau) is criticized because of the high possibility of false-positive results, given that other diseases distinct from AD may also present with abnormal CSF concentrations of tau, modifying these ratios in the absence of amyloid pathology. Although it represents a challenge, the high accuracy of the values of these ratios found in some studies reveals that their use is at least promising.12,36-38
For both diagnostic tests, the decision tree for the MCI group showed low predictive values of 47.5 and 62%. The predictive value and accuracy of the method was substantially improved when the MCI group was removed from the analyses. In similar studies, predictive values in the classification of MCI subjects have been characteristically lower than those found in the classification of AD and HC.35,45 We understand that the diagnosis of MCI, when established according solely to clinical parameters, yields a heterogeneous group of patients regarding the biological nature of AD. That is to say, the MCI group encompasses both cases of MCI due to AD and cases of MCI unrelated to AD pathology. The distinction between these two subgroups of MCI requires the incorporation of biomarkers for an appropriate diagnostic workup of pre-dementia AD. Therefore, the classificatory efficiency of AD-related biomarkers to depict cases of MCI (as a whole) is, in fact, expected to be poor. However, significantly better diagnostic accuracy was obtained in differentiating HC from patients with dementia (AD), where one expects that most cases of AD will display its "pathological signature in CSF" and most HC will not. Therefore, on clinical grounds, biomarker cutoff scores (i.e., defined biologically according to the presence of AD pathology) must ideally be combined with clinical information to define cases of MCI. This is a key recommendation for the use of AD biomarkers to predict the dementia outcome among samples of MCI.
As a limitation of the present study, we acknowledge that the clinical diagnosis of AD may be confounded by other (less frequent) forms of dementia that present with late-onset, predominantly amnestic deficits, and hippocampal atrophy. These cases display a pattern of CSF biomarkers distinct from that found in AD. Despite having conducted a thorough investigative procedure during the initial clinical assessment and diagnostic classification, we understand that certain non-AD conditions such as limbic-predominant age-related TDP-43 encephalopathy, hippocampal sclerosis, primary age-related tauopathy, and argyrophilic grain disease may be very difficult to differentiate from late-onset AD on clinical grounds. This shortcoming could have been overcome by the inclusion of amyloid-PET in the diagnostic workup of the present sample. Regarding the limited predictive value for the identification of cases of MCI in this sample, we speculate that the stratification of the MCI group according to the magnitude and type of cognitive deficits (i.e., amnestic-, non-amnestic-, and multiple domain MCI), therefore yielding distinct clinical features that may be related to the underlying pathology, will probably add predictive value to automated classifications based on AD-related biomarkers. Furthermore, we did not observe differences in the levels of Aß1-40 and Aß1-42 when using the MilliplexT MAP kit; this could be due to the high standard deviation of these markers. The use of two kits from different manufacturers was due to the discontinuation of the INNO-BIAT AlzBio3 from Fujirebio, and the kits have very different sensitivities, which became a source of bias for comparison of the created models. Another limitation of our study is the absence of comparison of this decision-tree model with other strategies usually used in research settings to define cutoff values for CSF biomarker concentrations. However, automatic classifications based on decision-tree models have long been used as a framework for the analysis of CSF biomarkers.46,47 After thorough analysis of the viability of automated methods - starting with this preliminary study using a decision tree-based method - the next steps would be: i) actual validation of the method, comparing it with other well-established models; ii) inclusion of other variables, e.g., APOE, sex, and age, in the model; and iii) use of other samples from different populations to avoid selection bias.
There are several benefits in using decision trees to subsidize the inclusion of biological information into clinical practice. Decision-tree methods are easily interpreted and intuitive and can better integrate CSF biomarker interpretation into routine procedures in clinical settings, where the provision of information from multiple biomarkers may help in differential diagnosis and prediction of outcomes. Finally, such input based on disease-specific biological information may help identify cases with atypical clinical presentations. Our final decision-tree model presents simple outcomes compatible with the pathophysiology of AD (i.e., low CSF concentrations of Aß1-42 and high t-tau), which facilitates its use in clinical practice. In our group, we believe that the use of decision trees can improve diagnostic accuracy and make CSF biomarkers more accessible to clinical settings.
The need for technical and methodological improvements is paramount if a more generalized clinical application is to be achieved. In addition, the incorporation of CSF biomarkers in the clinical management of cognitive syndromes is an important and expected development. Although presented with preliminary findings, the decision-tree method used in this study can support further investigations when applied to a diagnostic algorithm. Likewise, the incorporation of biomarkers into research settings relies on well-validated and unquestionable utility, presenting them as reliable parameters for recruitment in more homogeneous samples for clinical trials, particularly those that pursue disease modification. In addition, they are used for monitoring the effects of interventions.48 However, clinical use of these tools still requires caution. CSF analysis needs validation across different research centers, and significant technological improvement in parts of the involved processes is still required, in addition to the discussion of regulatory and ethical implications.49,50
Research on biomarkers of AD has seen significant development in recent years. However, although clinical diagnosis can now be ascertained by these biomarkers, significant challenges remain, such as improving accuracy in differential diagnosis in research settings, early diagnosis before the onset of symptoms, and distinguishing AD from other diseases that mimic its classic clinical presentation. Recent studies point to future promising directions with the use of automated techniques for biomarker analysis, such as decision trees. These strategies make CSF biomarkers more reliable and accessible. The model presented in this study had strong accuracy, moderate coefficients of agreement, and uses CSF biomarkers of the two most established pathophysiological aspects of AD, making this strategy assertive and useful for routine implementation in research practice. It is important to note that these models need to be continuously calibrated and improved in order for the projections presented to be applicable and reliable.
ACKNOWLEDGEMENTS
This study was supported by Fundação de Amparo à Pesquisa do Estado de São Paulo (FAPESP; grant no. 2017/26291-2), Instituto Nacional de Biomarcadores em Neuropsiquiatria (INBioN; grant no. 2014/50873-3), Conselho Nacional de Desenvolvimento Científico (CNPq), and Coordenação de Aperfeiçoamento de Pessoal de Nível Superior (CAPES). The Neuroscience Laboratory receives financial support from Associação Beneficente Alzira Denise Hertzog da Silva (ABADHS).
Disclosure
The authors report no conflicts of interest.
 PDF
 Print
 Send this article by email
 How to cite this article
 Submit a comment
 Mendeley
 Pocket
 Share on Facebook
 Share on Twitter